
Start with a published band and ask what historically happened after price first touched a specific depth.
Trading Terminal / How to use / Risk Management
Turn a first touch into a probability question.
A screen-by-screen guide to selecting a market, reading the Probability Map, separating model deadlines from chart windows, judging confidence, opening the expanded terrain and using Risk Control without confusing scenario evidence for a trade instruction.
First touchThe condition comes first
4 deadlines60m · 720m · 5d · 20d
2 evidence viewsMap and Model Curves
0 trade mutationsContext never changes state
The probability only makes sense after all four parts of the question are fixed.
Use the result as context. Return to the owning trade card for entry, stop, lifecycle and execution state.
Risk Management / Product tour
Orient yourself on the loaded workspace.
The selected product, universe rail, surface timestamp, model horizon, price window, selected outcome and chart each answer a different question. Read them in that order.
The real product surface
This account-safe production capture shows Risk Management selected with AAPL loaded. The universe stays on the left; the Probability Map uses the full analysis area on the right.
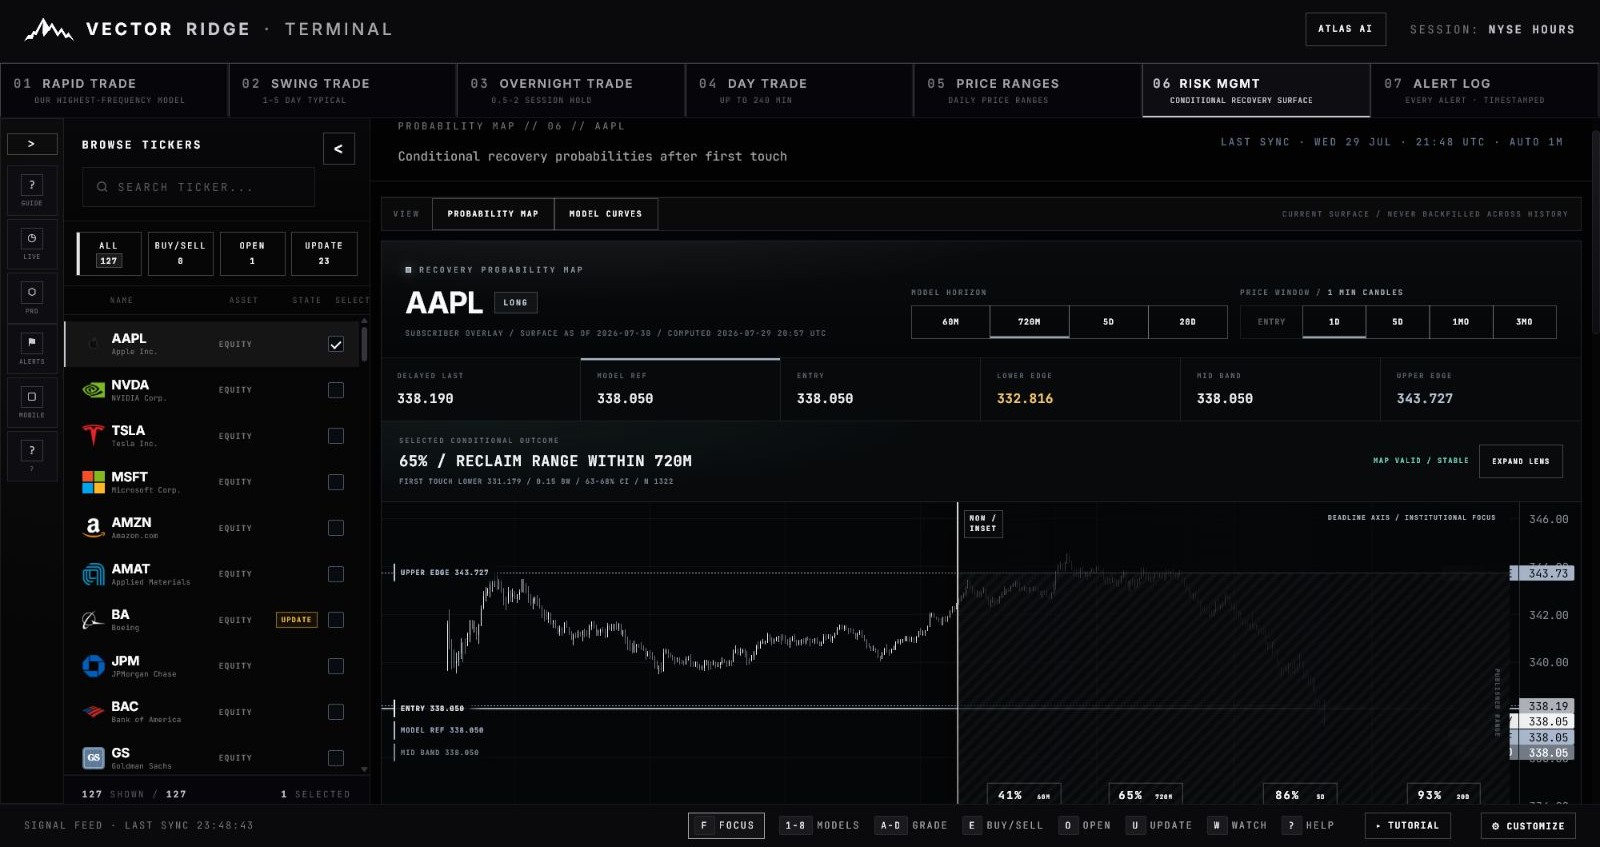
1Section 06 is Risk Management. Probability Map is the analysis tool inside it.
2Search, filter and select a covered market here. Coverage is dynamic, so use the current rail rather than assuming every symbol is available.
3Probability Map places one selected conditional outcome on price; Model Curves compare the complete support and resistance profiles.
460m, 720m, 5d and 20d change the probability deadline. Entry, 1D, 5D, 1M and 3M change only the candle window.
5The selected outcome states probability, target, deadline, first-touch level, band-width depth, confidence interval and sample size.
6The left side is observed price history. The right side is a deadline surface—not a forecasted price path.
Screenshot rule: prices, coverage, probabilities and timestamps are frozen at capture time. Reopen the live surface for the current model snapshot.
Risk Management / Chapter 01
Know exactly what question the product answers.
Risk Management estimates a conditional outcome after a published band is touched. It does not forecast the next candle, promise a destination or issue a trade instruction.
Stage 01 / Market context
Select a market and band
Start with the current surface, side and published lower or upper edge.
Stage 02 / Condition
Price first touches a depth
The event is defined by target, exact first-touch price and band-width depth.
Stage 03 / Answer
Probability by a deadline
Read the estimated recovery or retrace probability, confidence interval and sample size.
Conditional evidence
“After this first touch, how often did the selected outcome occur by this exact deadline?”
Expected path
The shaded terrain is not a projected route for the next candles and the probability is not an expected price.
Guaranteed level
A high probability does not make the target certain or remove loss and gap risk.
Trade authority
The surface never creates, updates or closes a Terminal trade.
Risk Management / Chapter 02
Select one covered market deliberately.
The universe rail controls which surface is loaded. Search and filters narrow the list; the checked selector identifies the active market.
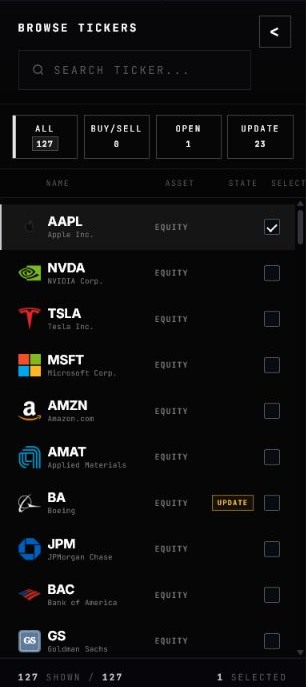
1Search by ticker. If a symbol is not covered, do not substitute another market or invent a probability.
2All returns the current calibrated universe. The displayed count can change as source coverage changes.
3Buy/Sell, Open and Update are navigation context filters. They do not turn Risk Management into a trade scanner.
4The checked selector is the market currently driving the map, values, source status and Risk Control levels.
5Company and asset labels help confirm identity. Always verify the ticker header again after selection.
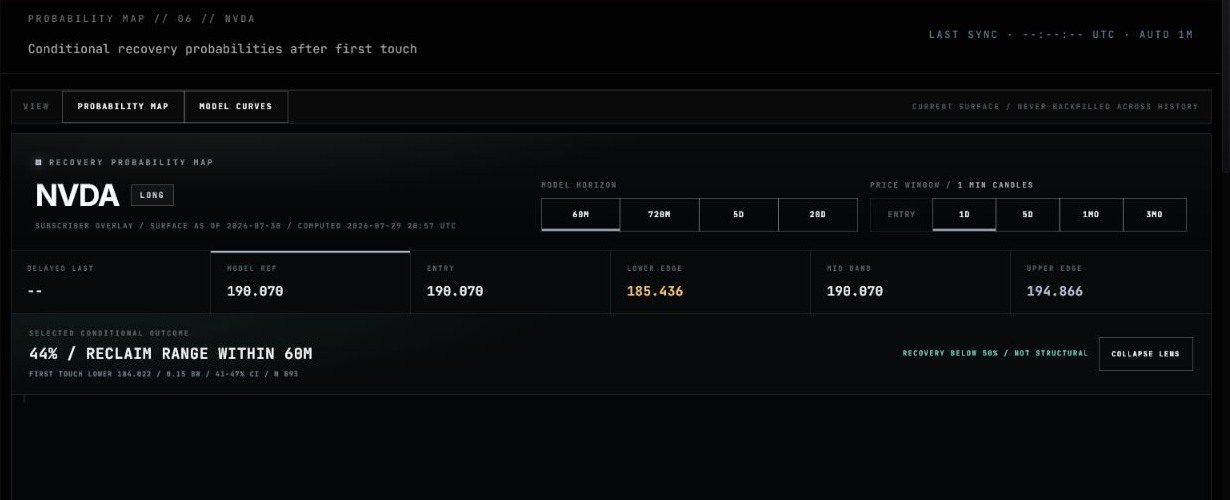
1Confirm the large ticker header after every selection. It is the clearest defense against reading a stale prior market.
2The selected deadline persists as a control choice, but every probability and level is recalculated from the newly loaded surface.
3First-touch price, confidence interval and sample size are market-specific evidence. Never carry them from one ticker to another.
No coverage is an honest state. If the surface is unavailable, keep the unavailable message visible and use another evidence source. Do not fabricate a substitute range or probability.
Risk Management / Chapter 03
Read the Probability Map from the header down.
The map header establishes market, side and freshness. Controls define the question. The selected-outcome strip answers it. The chart shows the observed context and published deadline terrain.
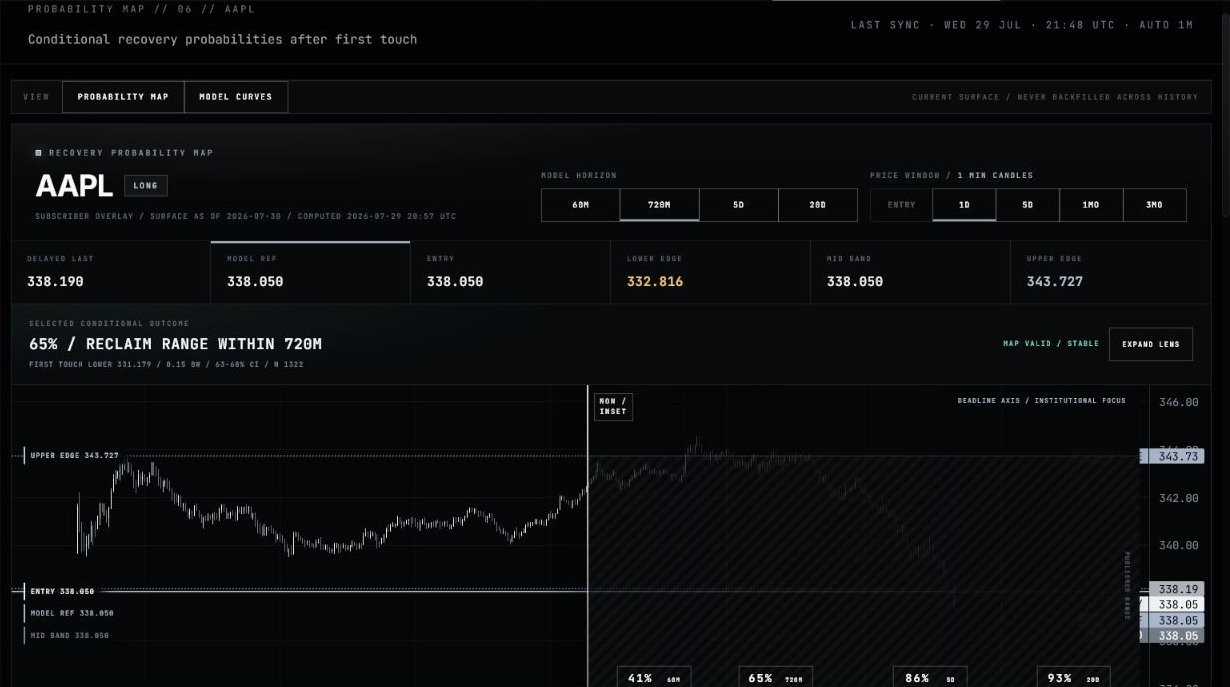
1The ticker and LONG label define the current public surface. There is no public long/short switch in this release.
2Surface as-of and computed time identify the model snapshot. They are separate from the candle timestamp and Terminal refresh.
3Model horizon chooses one exact published probability deadline: 60m, 720m, 5d or 20d.
4Price window changes the visible candle history. It never changes the model deadline.
5Delayed last, model reference, entry and band edges anchor the displayed market context. They are not broker quotes or orders.
6This strip is the answer: outcome probability, deadline, first-touch level, depth, confidence interval and sample size.
7The chart places historical candles left of NOW and probability terrain right of NOW. The right side is not a simulated candle path.
Risk Management / Chapter 04
Put the first-touch condition before the percentage.
A probability without its target, depth and deadline is incomplete. The map conditions on price first reaching one published depth around the selected band.
Price / vertical axis
Exact probability deadline →
Target
Choose lower/reclaim or upper/retrace on the current long-side surface.
First-touch price
The published level at which the conditional sample begins.
Depth
The touch is expressed in band widths so shallower and deeper points remain comparable.
Deadline
The result belongs to one exact cell. Do not interpolate a probability between published horizons.
The vertical axis is price; the horizontal future axis is deadline. A colored zone describes probability support after a touch. It does not say where price is expected to travel candle by candle.
Risk Management / Chapter 05
Read one selected outcome completely.
Do not stop at the large percentage. The target, horizon, first-touch level, normalized depth, interval, sample and stability state complete the evidence.
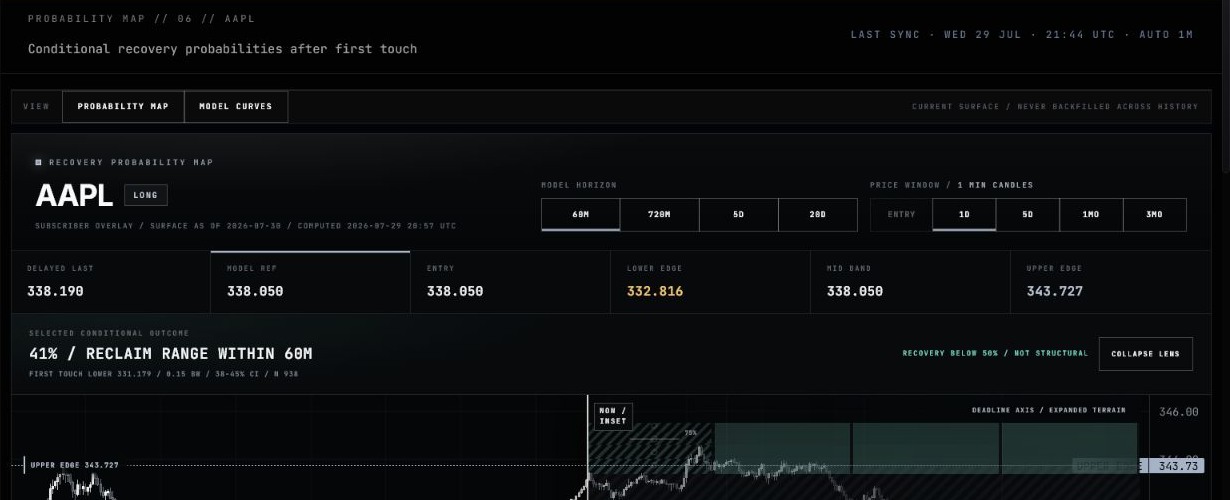
160m is the selected model deadline. The other cells remain separate published outcomes rather than interpolated points.
2The percentage estimates how often the selected outcome occurred under the defined condition.
3RECLAIM RANGE names the outcome being counted. A percentage without this target can be misread.
4First-touch level and band-width depth identify where the conditional sample begins.
5CI gives the uncertainty range; N gives the historical sample size. Both matter before judging support.
6Map valid or stable describes statistical support for this surface cell. It does not say the market or trade is safe.
| Readout | Question it answers | Common mistake |
|---|---|---|
| Probability | How often did the selected outcome occur after this first touch? | Treating it as certainty or expected return. |
| Outcome | Is the sample counting reclaim or retrace? | Reading the same percentage as both outcomes. |
| Deadline | By which exact published horizon? | Assuming a 720m cell implies the 60m result. |
| First-touch level | Where does the condition begin? | Treating the level as an order or current stop. |
| Band-width depth | How far into or beyond the band is the touch? | Comparing raw dollars across unlike markets. |
| Confidence interval | How wide is the uncertainty around the estimate? | Ignoring a wide interval because the headline is high. |
| Sample size | How much historical support contributes? | Equating a small sample with a well-supported cell. |
Risk Management / Chapter 06
Never confuse probability deadlines with price windows.
The two control groups sit together but do different jobs. One changes the model question; the other changes only the chart context.
60m
720m
5d
20d
Each button selects one discrete published probability cell. Switching from 60m to 720m can change probability, interval, sample, stability and deadline terrain.
Entry
1D
5D
1M
3M
These buttons change how much observed price history surrounds NOW. They do not recalculate the selected 720m probability or create a new model horizon.
Fast check: if the large outcome text changes, you changed the model question. If only the visible candles change, you changed the price window.
Risk Management / Chapter 07
Read lower support and upper resistance on the current long-side surface.
The public release currently presents a long-side surface. Lower touches ask about reclaiming the range; upper touches ask about retracing to the upper edge.
Lower / support side
First touch below
Condition on a published lower depth and count whether price reclaims the range by the selected deadline.
Current band
Inside band
Model reference, lower edge, mid band and upper edge define the current surface geometry.
Upper / resistance side
First touch above
Condition on a published upper depth and count whether price retraces to the upper edge by the selected deadline.
No public side switch: do not translate these labels into an unpublished short-side surface. Use the exact target language shown by the live product.
Risk Management / Chapter 08
Use Probability Map and Model Curves for different jobs.
The map is best for one selected point in price context. Model Curves are best for comparing how the complete probability profile changes across depth and horizon.
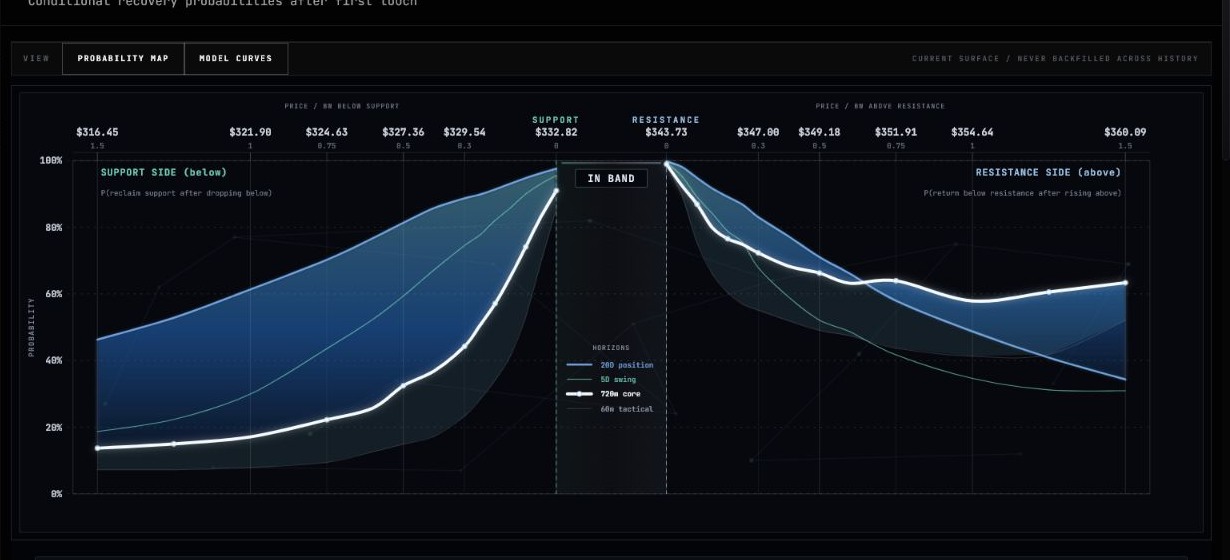
1The left profile shows reclaim probability across published depths below support.
2The center marks the in-band area. The support and resistance questions remain distinct rather than being joined into one path.
3The right profile shows retrace probability across depths above resistance.
4Each line belongs to one exact published horizon. Curves reveal divergence that a single headline probability can hide.
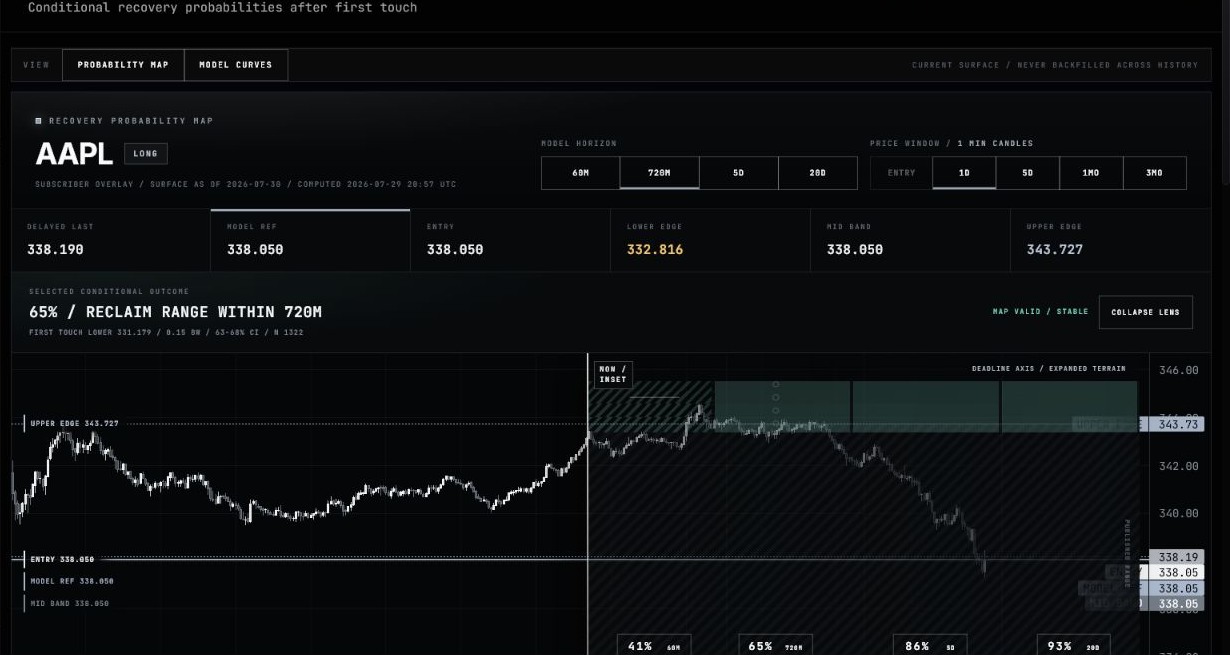
1Observed delayed candles remain left of NOW. This is reference context, not the probability sample replayed through history.
2NOW / INSET is the boundary between observed candles and the conditional deadline surface.
3The enlarged terrain exposes support, low-support hatching and structural zones that are compressed in the standard view.
460m, 720m, 5d and 20d remain discrete. The surface steps through published depths and does not interpolate a hidden in-between horizon.
5Collapse Lens returns to the standard workspace without changing the selected market, target, depth or horizon.
Risk Management / Chapter 09
Judge support, not just the headline.
Confidence comes from the interval, sample size and structural support together. The interface fades or hatches weak areas so uncertainty remains visible.
The estimate is better supported within the current surface. It is still probabilistic and can fail.
Keep the uncertainty range beside the headline and avoid false precision.
The map can mark a structural cliff when probability falls below support thresholds. Do not treat the cell as a clean setup.
What “map valid / stable” actually means
Inputs are usable
The selected surface cell has the required published fields and can be rendered.
Statistical support
Sample and interval support clear the current stability criteria.
No market guarantee
Validity does not certify the trade, eliminate tail risk or promise the selected outcome.
No streaming claim
The surface can be a dated model snapshot while chart context updates on a separate cadence.
Risk Management / Chapter 10
Use Risk Control as scenario evidence—not an order ticket.
Risk Control translates the selected surface into current, band, reduce, exit and target levels. Those levels help frame conditional risk; they do not automatically replace a trade card's active stop.
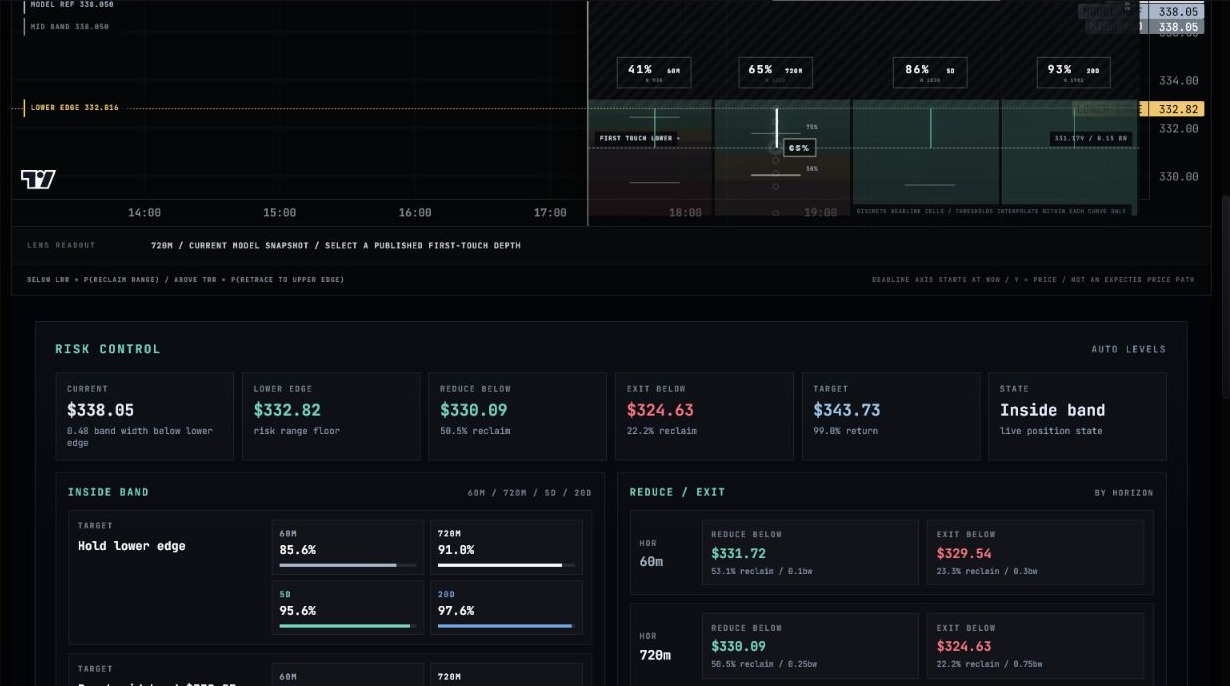
1Current is the panel's reference level and can be delayed. Verify the owning trade card for live trade state.
2Lower edge defines the current risk-range floor used by the surface geometry.
3Reduce below is a scenario threshold with its reclaim probability and normalized depth attached.
4Exit below is the deeper scenario threshold. It is not automatically the stop published on an open trade.
5Target reflects the selected band geometry and scenario. It is not a guaranteed take-profit.
6State summarizes where the current reference sits relative to the band. It does not create a lifecycle event.
Risk Management / Chapter 11
Separate surface freshness from price freshness.
The probability surface, delayed candle feed and optional trade context have separate sources and clocks. The page exposes those boundaries so a partial source failure stays honest.
As-of date
The dated probability snapshot used for the selected market. It is current-surface evidence and is never backfilled across the historical candle path.
Build time
When the current surface was calculated. This is not the same as the most recent candle.
Delayed context
Candles and delayed last can update independently and are reference data rather than a broker feed.
Optional overlay
Entry context can help choose the initial window but never becomes trusted trade state inside the map.
Honest degraded states
Surface available, price chart unavailable
Keep the exact probabilities and source status visible; do not hide valid model evidence because candles failed.
Fallback surface loaded
Show the fallback source and dated as-of/computed fields. Never describe it as a fresh live surface.
No calibrated coverage
Show unavailable and stop. Do not synthesize a range, probability or substitute ticker.
Trade context missing
Use a neutral chart window such as 1D. Do not invent entry or position state.
Freshness rule: a newer candle does not make an older probability surface newer, and a current surface does not make delayed price a live broker quote.
Risk Management / Chapter 12
Use the same 60-second workflow every time.
The order matters because each step prevents a common category error: wrong ticker, wrong target, wrong horizon, unsupported headline or mistaken trade authority.
Confirm Risk Management and ticker
Section 06 must be selected and the large ticker header must match the market you intend to study.
Read side and freshness
Confirm the current public long-side surface, surface as-of date and computed time.
Choose target and depth
Lower/reclaim or upper/retrace defines the counted outcome; depth defines the first-touch condition.
Choose one exact deadline
Select 60m, 720m, 5d or 20d. Never infer an unshown in-between probability.
Read the complete outcome
Probability, target, first-touch level, depth, confidence interval, sample size and stability belong together.
Choose a useful price window
Entry for a valid attached entry; otherwise 1D, 5D, 1M or 3M for context. This does not change the probability.
Expand only when needed
Use the lens for exact terrain and Model Curves for profile comparison, then return to the selected point.
Return to the trade authority
If a live trade is involved, verify current state and active SL on its owning card before taking any action.
Risk Management / Chapter 13
Use the mobile map as a focused point reader.
Mobile stacks the workspace into one column. It keeps ticker, horizon, price window, selected outcome, target and depth controls, while hiding the desktop Model Curves switch.
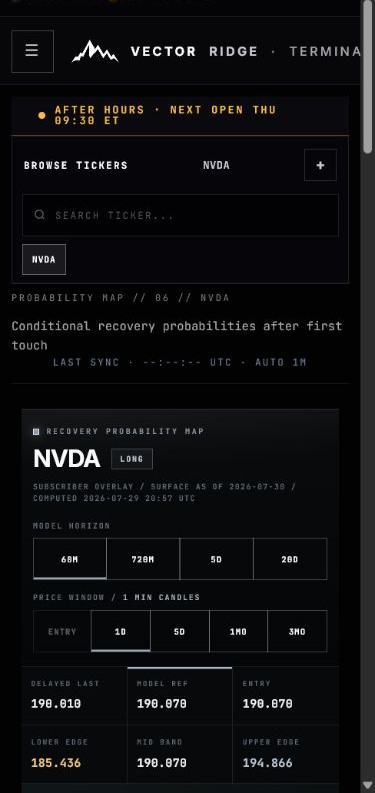
1Open Browse Tickers, search and select. The compact chip confirms the loaded market after the picker closes.
2The large ticker, side and surface dates remain the first evidence block on mobile.
3Swipe or tap 60m, 720m, 5d or 20d to change the exact probability deadline.
4Entry, 1D, 5D, 1M and 3M still change only the candle window.
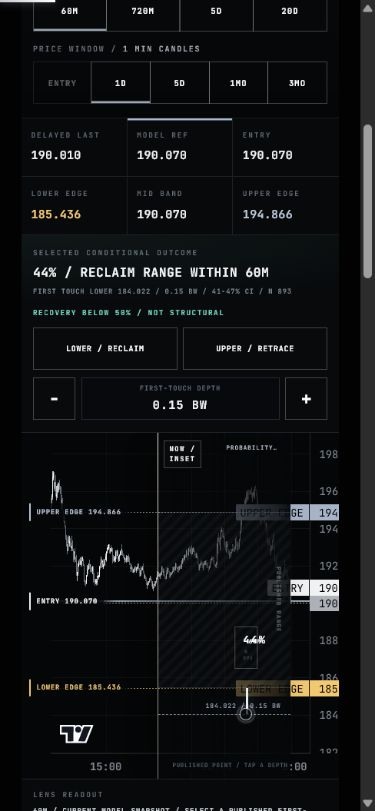
1Read the complete selected outcome before touching the chart: probability, target, deadline, level, depth, CI and N.
2Lower / Reclaim asks the support-side question on the current long-side surface.
3Upper / Retrace switches to the resistance-side question.
4Minus and plus step through published first-touch depths. They do not interpolate an invented point.
5The selected published point remains attached to its exact deadline. The line around it is context, not an expected price route.
Mobile-specific rule
Do not look for Model Curves on a phone. The mobile layout intentionally prioritizes one target, one published depth and one exact deadline. Use desktop when you need the complete curve comparison or expanded terrain.
Risk Management / Chapter 14
Use the right authority and keep every boundary visible.
The product is strongest when the conditional question is precise and the result stays in its lane. Use these checks before relying on a surface.
Confirm the market
Ticker header and selected rail row must agree after every switch.
Name target and touch
Lower/reclaim or upper/retrace, exact level and band-width depth come before probability.
Use one published cell
60m, 720m, 5d and 20d remain discrete; price windows are separate.
Read CI and N
Stability is statistical support, never a guarantee or safety label.
Common questions
Is the Probability Map predicting the next price path?
No. It estimates a conditional recovery or retrace outcome after a first touch. Price is the vertical axis and the future horizontal axis contains exact deadlines, not projected candles.
Does a 65% 720m result imply the 60m probability?
No. Each horizon is a separate published cell. Select 60m to read the 60m result.
Does choosing 5D in the price window change the 5d probability?
No. 5D in Price Window changes candle history. 5d in Model Horizon changes the probability deadline.
Is “map stable” the same as “safe trade”?
No. Stable describes statistical support for the selected cell. It does not certify a trade or remove market risk.
Is Risk Control's exit level my active Terminal stop?
Not automatically. Risk Control supplies scenario evidence. The owning trade card remains the authority for the published active SL.
Why do the surface date and candle time differ?
They come from separate source chains. The probability surface is a dated model snapshot; delayed price context can update independently.
What should I do if the chart fails but probabilities remain visible?
Use the probability values only with their exact source, date, target, depth and deadline. Treat the missing chart as unavailable reference context rather than discarding valid surface data.
What if my ticker has no surface?
Respect the unavailable state. Do not invent a substitute range or transfer values from another ticker.
Can Risk Management open, update or close a trade?
No. It supports risk analysis only. Trade cards, Alert Log and Performance retain lifecycle authority.
Ready
Open Risk Management with the condition fully defined.
Confirm the market, surface date, target, first-touch depth and exact horizon. Then read probability, interval and sample together—and return to the owning trade card for live state.