The live card—not a saved alert or old screenshot—is the authority for the current lifecycle state and current manager level.
Product guide / Trading Terminal
Read the Terminal without guessing.
The complete 15-chapter, screen-by-screen manual for every trade board, state, manager level, chart, alert and performance record—on desktop and mobile.
15Guided Terminal chapters
6Dedicated deep-dive guides
15Annotated product screens
1Economic record per trade
Identify the product and lifecycle first. Then read direction, entry, active manager level and P&L.
Charts and Performance preserve the entry, updates, close, elapsed time and recorded result.
Choose your route
Start broad. Go deep when you need it.
The full Terminal manual continues below. These dedicated walkthroughs isolate one product at a time and explain its board, states, charts, alerts, records and mobile presentation screen by screen.
 01
01
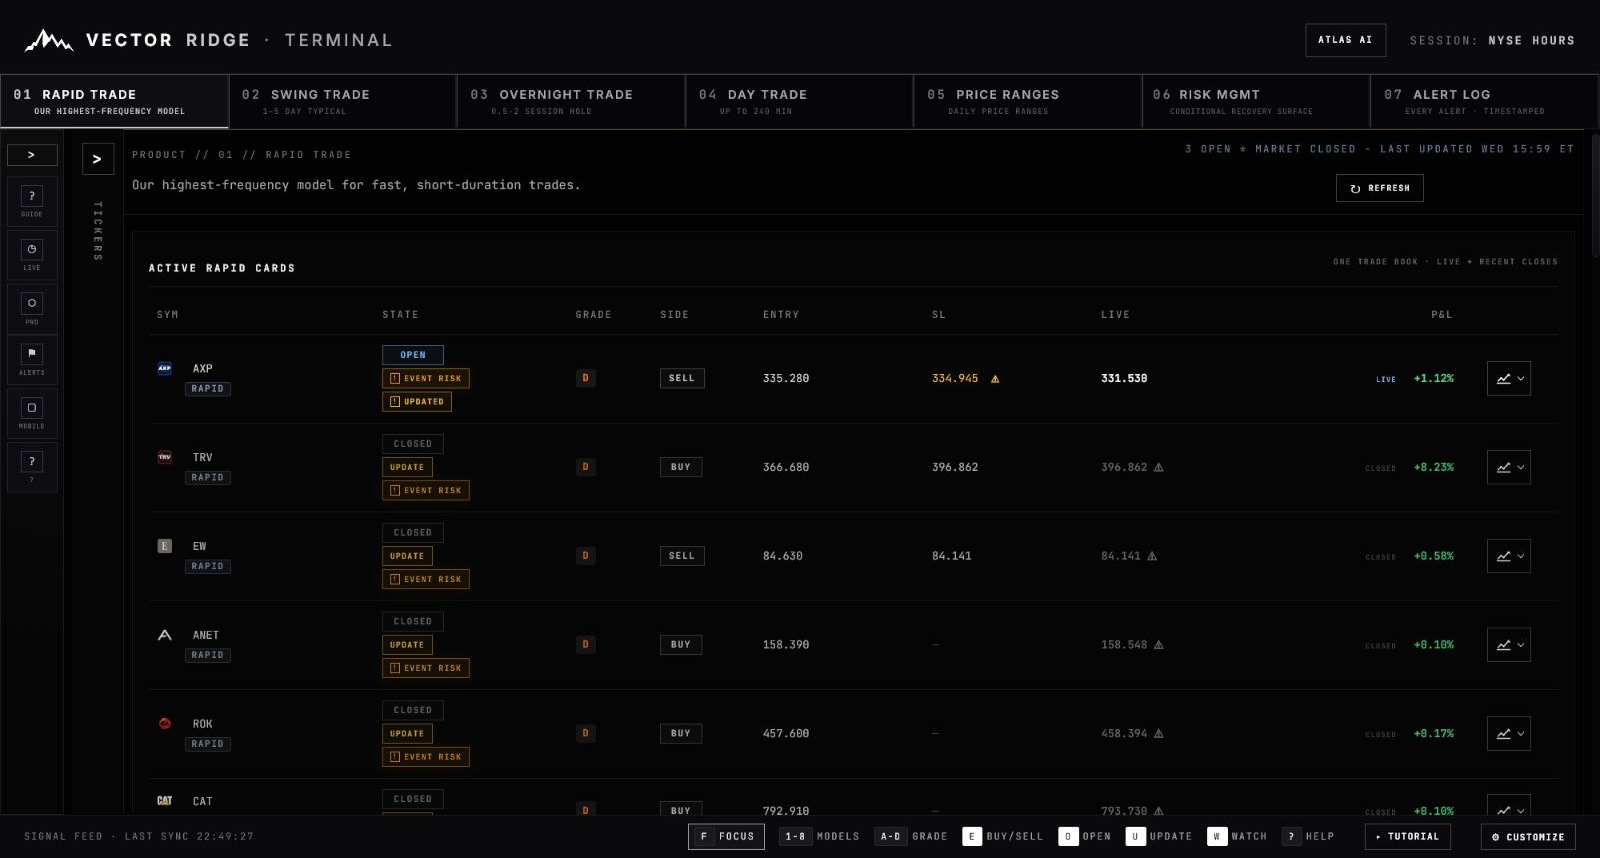
Rapid Trade
Understand native Rapid cards, distributed trades, visibility ordering, entry states, charts and the single-record rule.
Open complete walkthrough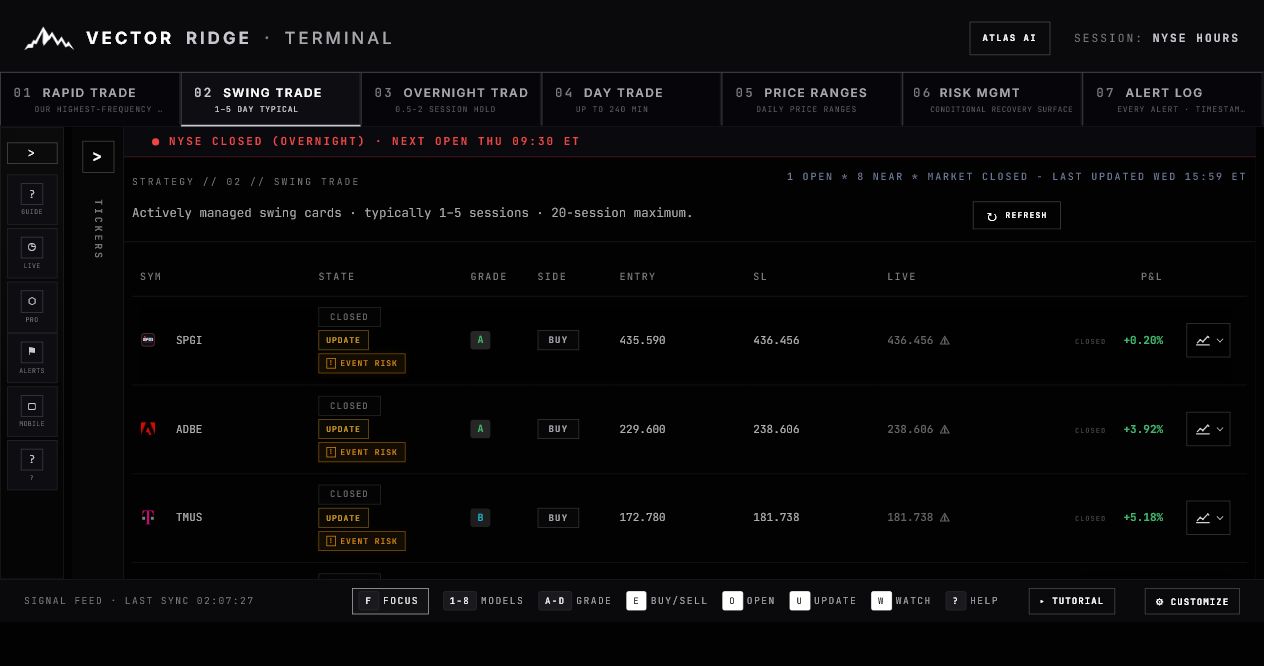 02
02
Swing Trade
Read the longer hold, current manager level, stop changes, retained context and exact closed-trade receipt.
Open complete walkthrough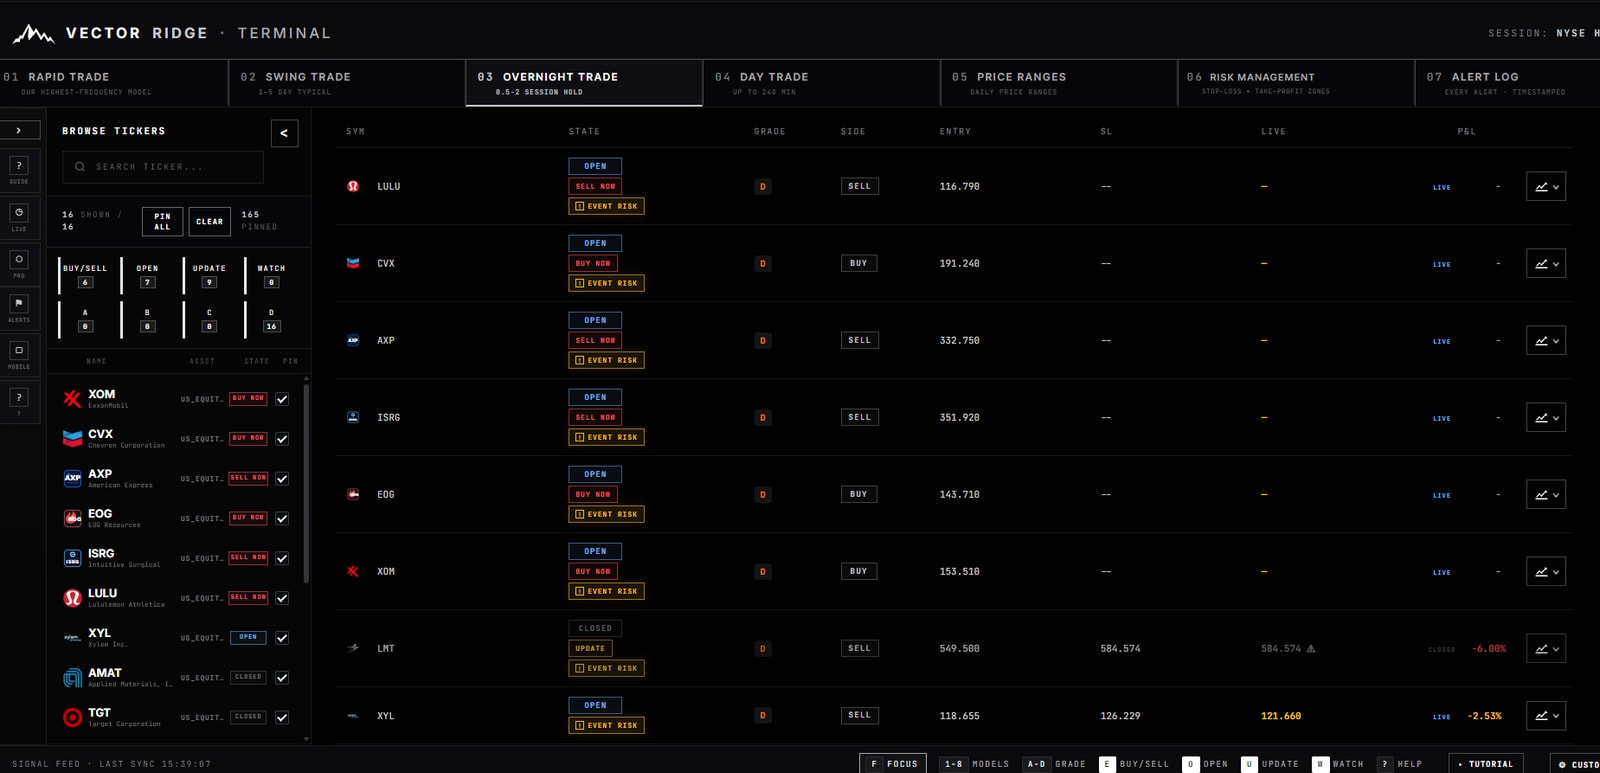 03
03
Overnight Trade
Follow cross-session positions, current stop states, event-risk retention, shared Rapid identity and mobile alerts.
Open complete walkthrough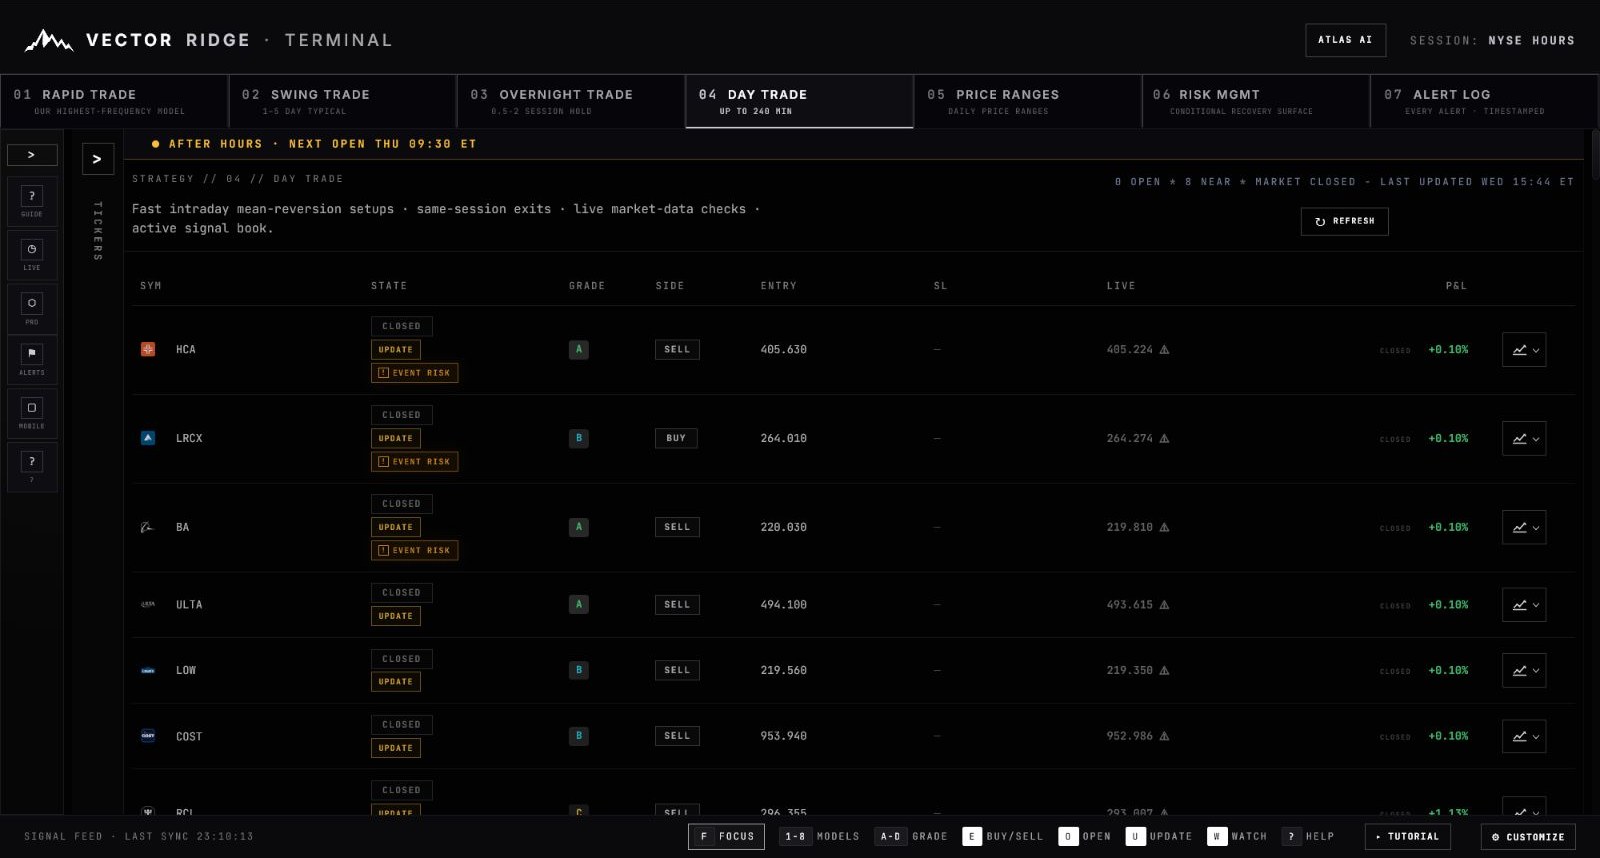 04
04
Day Trade
Separate preparation from an open position, understand the session clock and trace each intraday lifecycle event.
Open complete walkthrough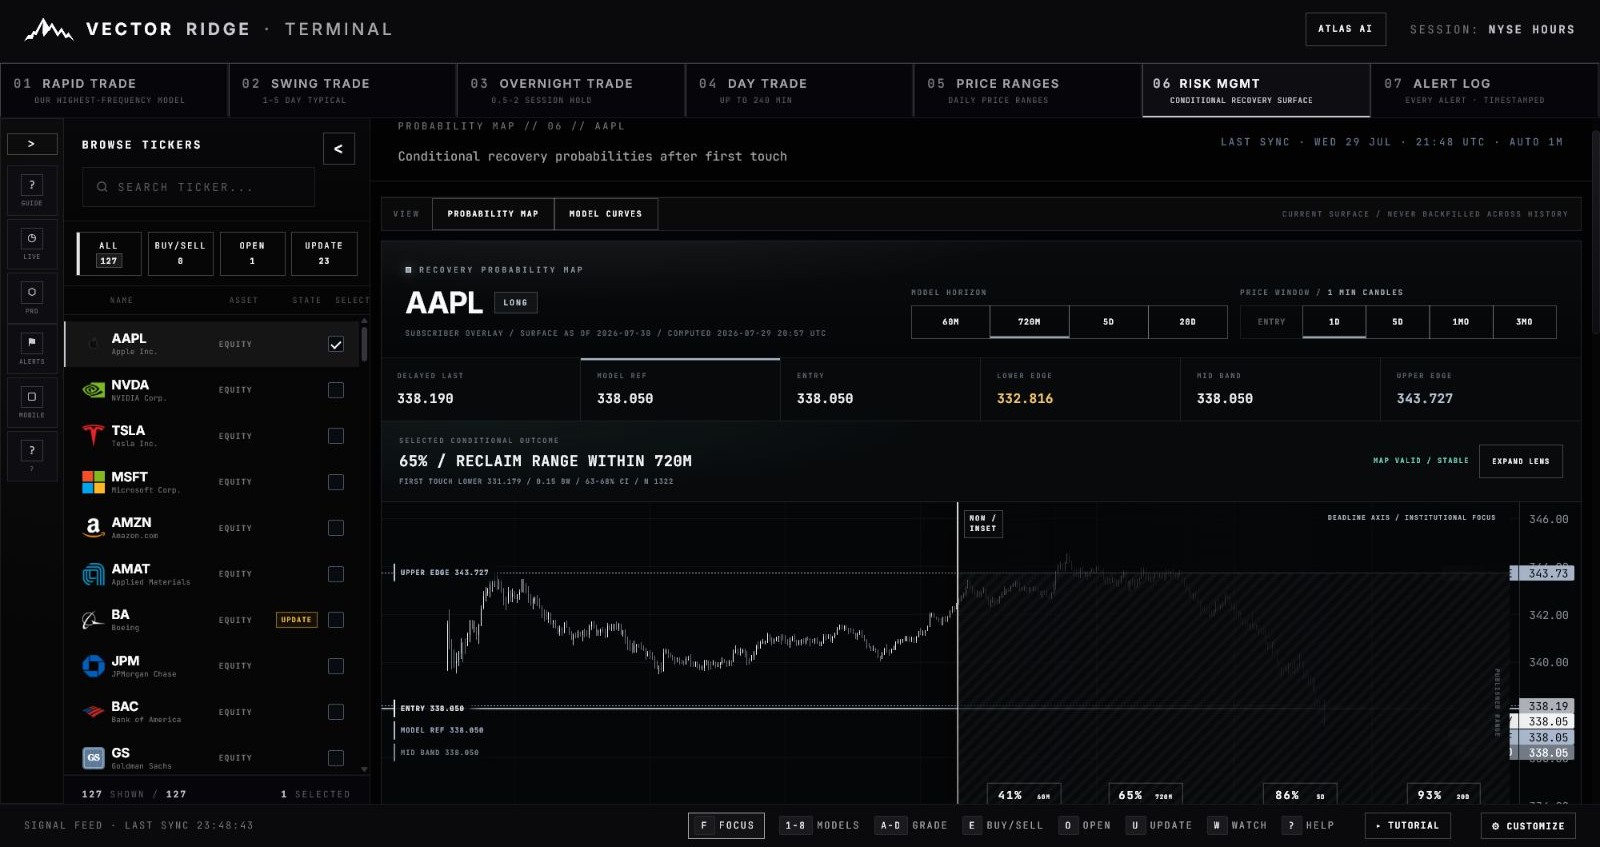 05
05
Risk Management
Use the probability surface, exact horizon, first-touch depth, confidence interval and sample size without mistaking it for a forecast path.
Open complete walkthrough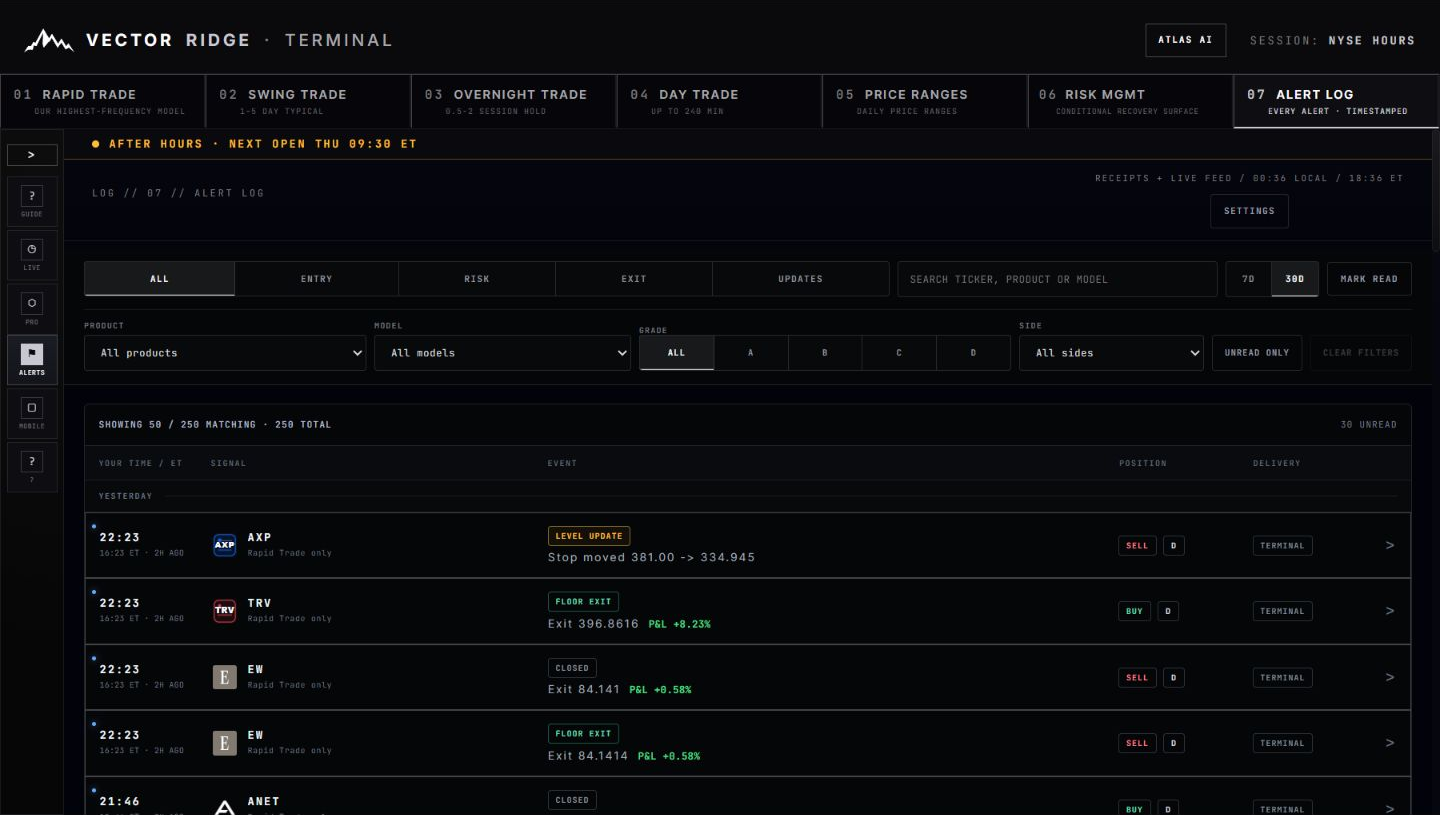 06
06
Alerts
Decode entries, level changes, warnings, closes, delivery setup and the handoff from an alert to the current trade card.
Open complete walkthrough01
Choose the right product. Product boundaries come before grades, levels or P&L.
02
Follow the numbered markers. Each screenshot explains one visible control or field at a time.
03
Open the original screen. Use Full screen whenever a label or timestamp needs closer inspection.
04
Return to the live card. The guide explains the interface; the current Terminal holds the newest state.
01 / Orientation
One Terminal. Clear product boundaries.
The top navigation switches the active product or supporting workspace. Each trade product owns its own horizon, state and manager behavior.
The fastest way to get oriented
Read the Terminal from the outside in. First choose the correct product tab. Next confirm the market session and the product summary. Then scan the table from symbol through state, grade, side, entry, stop, live price and P&L. Open the chart only after you know which trade record you are inspecting.
The 60-second operating loop
01
Start with the notification or Alert Log event
Identify what changed, its timestamp and the owning product. The alert is the historical event—not the current position state.
02
Open the current product card
Confirm whether the position is preparing, open, updated or closed and read the newest manager level.
03
Expand the chart
Place entry, level changes, live or closed price and their timestamps on the same candle history.
04
Keep following the live card
New alerts extend the same lifecycle. They do not create another economic trade.
05
Reconcile the close in Performance
Use the final receipt for exact entry, exit, duration, close reason, product ownership and recorded result.
Rapid Trade
The high-activity feed. It can also surface a trade owned by Swing, Overnight or Day without creating a second economic trade.
Swing Trade
Actively managed multi-session positions, typically one to five sessions with a longer maximum hold.
Overnight Trade
Short-horizon recovery and mean-reversion setups designed to cross a session boundary when required.
Day Trade
Same-session positions with a bounded regular-hours clock and active intraday risk management.
1The numbered tabs are the primary workspaces. Select the product before interpreting any grade or level.
2The product line states the active horizon and purpose. It is your context check before reading a row.
3The table is the current trade book. Open positions and recent closes share the board, but their visual tone and state labels differ.
One economic trade, one result. A native Swing, Overnight or Day trade may also appear in Rapid. The product badge tells you the owner; Performance deduplicates it into one recorded trade.
02 / Card anatomy
Decode the row in one pass.
State is the instruction. Side is the direction. Entry and the current manager level are the prices. P&L is the result.
Read left to right
| Field | What it means | What to check |
|---|---|---|
| Symbol / product badge | The instrument and owning product. Rapid can display a native trade from another product. | Confirm the badge before comparing hold time or stop behavior. |
| State | The current lifecycle instruction: watch, entry, open, update or terminal. | Use the newest state; do not act on an older phone notification. |
| Grade | A–D conviction inside that product. | Compare grades within the same product, not as a universal return promise. |
| Side | BUY benefits from a rise; SELL benefits from a decline. | Direction changes how you interpret entry, stop and P&L. |
| Entry | The recorded entry used by the trade record. | Use the timestamped chart marker to see when it became active. |
| SL / stop | The current manager risk level when the product publishes one. | A yellow warning marker means the level changed; hover or open the chart for detail. |
| Live / closed | The current reference price for an open trade or recorded close for a finished trade. | Open prices remain neutral; closed prices are muted so the lifecycle is obvious. |
| P&L | Current open result or recorded closed result. | Performance is the canonical closed-trade ledger. |
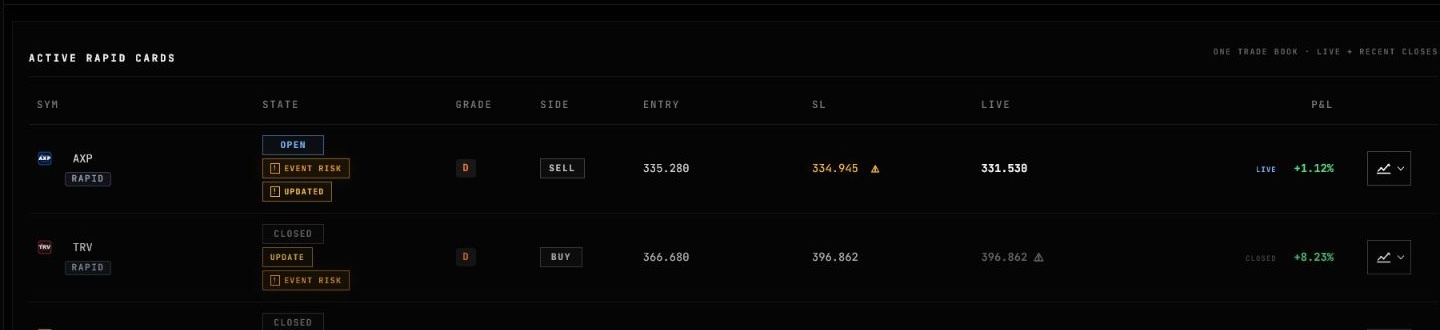
1The vertical state stack keeps OPEN or CLOSED separate from update and event-warning context.
2Grade belongs to the owning product; BUY or SELL defines how the price move affects P&L.
3Entry is the recorded starting reference. SL is the newest published manager level when one exists.
4Open rows show a current reference price; closed rows show a muted recorded exit so lifecycle is unmistakable.
5P&L carries the directional outcome. The chart control opens the full timestamped record beneath the row.
The state hierarchy
| State | Meaning | Expected response |
|---|---|---|
| Buy now / Sell now | A new entry instruction has been published. | Open the card, confirm product and side, then read the recorded entry and manager level. |
| Open | The position is active under its product manager. | Monitor the current stop, event warnings and P&L. |
| Near SL | Price is close to the active risk level. | Re-check the current card. This is proximity, not a separate trade. |
| New stop / Updated | The manager changed a level or instruction. | Use the newest stop and timestamp. Older values remain part of the chart history. |
| Closed | The economic trade is finished and has moved to history. | Use Performance for entry, exit, duration, close reason and final result. |
| Event risk | A scheduled catalyst fell inside the relevant monitoring window. | Treat it as a warning only. It does not create or force-close a trade. |
Blank can be valid. Not every product publishes the same fields. A blank target or stop can be intentional; never substitute a value from another product.
03 / Rapid Trade
The fastest live trade book.
Rapid prioritizes high-activity opportunities and gives users one place to see Rapid-only cards plus eligible native positions from the other trade products.
Begin with the product badge under the symbol. RAPID means the card is native to Rapid. A SWING, OVERNIGHT or DAY badge means the same economic position is also visible here for convenience. The Rapid view does not duplicate its entry, exit or P&L.
01
Scan current entry instructions first
BUY NOW and SELL NOW are the newest actionable states. OPEN rows are already active; CLOSED rows are recent records.
02
Confirm the product owner
Use the badge beneath the ticker so you apply the correct horizon and manager expectations.
03
Open the chart for timestamps
The dropdown carries the entry marker, active level, prior level changes and the complete trade view.
Board ordering: the newest lifecycle event remains the baseline. Live trades with a strictly positive return proven from their displayed entry and current mark receive the only visibility lift; flat, negative or unavailable-mark live trades are never boosted.
04 / Swing Trade
Multi-session management at a glance.
Swing cards are actively managed across sessions. Treat the displayed stop as the current manager level, not a static value from the entry day.
Swing Trade is built for positions that need more room than an intraday setup. The typical hold is one to five sessions, with a longer maximum. A trail-stop update can protect a winning trade before the position eventually closes.
1State badges are vertical so OPEN, UPDATE and EVENT RISK remain readable without colliding.
2The stop column displays the current manager level. Open the chart to see when a new level was added.
3Open P&L updates from the current reference price. Closed rows are visually muted.
05 / Overnight Trade
Short holds that can cross the close.
Overnight Trade is a short-horizon recovery and mean-reversion product. It may remain open across a session boundary, so the newest state, current stop and catalyst context must be read together.
The typical hold is roughly half a session to two sessions, but an earlier stop or close event can finish the record first. Event Risk is warning-only context and can remain attached after close so the original environment is preserved. The dedicated walkthrough covers every state, stop update, chart view, retained close, shared Rapid record and mobile alert in detail.
1OPEN means the position is still under management; UPDATE and CLOSED describe its latest terminal state.
2Event Risk is retained after close. It records context and never implies that the event itself forced the exit.
3The final P&L is the recorded result. Use Performance for exact entry, exit and duration.
06 / Day Trade
Same-session signals with a hard clock.
Day Trade is bounded to regular-session management. Preparation, active risk and the same-session clock are more important than an assumed multi-day thesis.
Day Trade positions are managed for up to 240 regular-hours minutes and never carry overnight. WATCH and ENTRY NEAR are preparation, not open positions. Once active, the current SL and the recorded close reason in Performance tell you how the trade was managed and which event ended it.
1The symbol is paired with the owning product. If the same trade appears in Rapid, it remains one economic record.
2BUY and SELL define the P&L direction. Always confirm side before reading a price move.
3The chart control opens the exact trade timeline without leaving the active board.
07 / Trade charts
Price, timing and manager history on one chart.
The expanded chart is the best place to answer when the trade entered, where the current stop sits and how price behaved afterward.
Open any chart from the right edge of a trade row. The panel expands beneath that record and keeps the surrounding board in context. Entry focus centers the chart around the recorded entry; the longer views widen the history without changing the trade record.
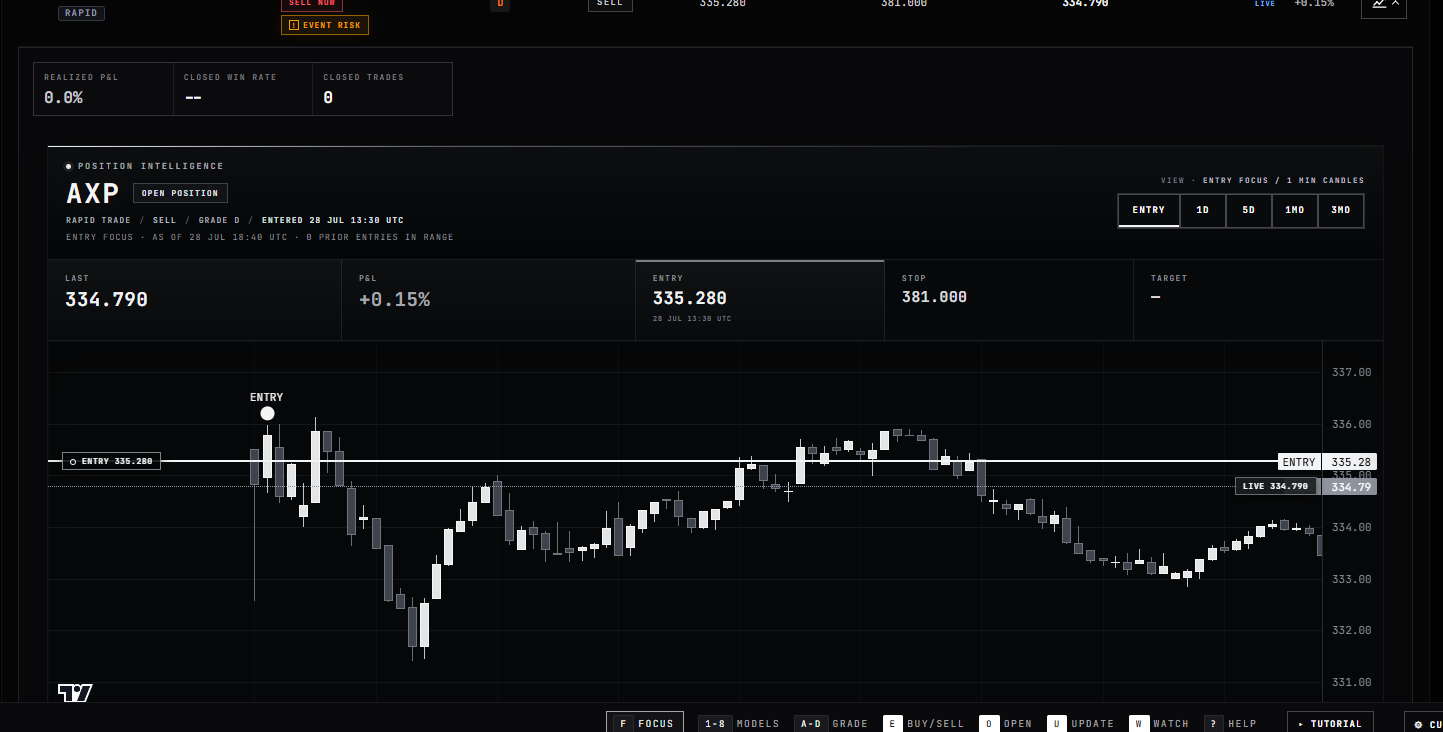
1The ENTRY marker is anchored to the recorded timestamp and price. Prior entry markers, when present, remain visually distinct.
2The STOP tile is the current manager level. Its timestamp appears when the level was updated.
3ENTRY, 1D, 5D, 1M and 3M change the viewport only. Manual zoom and pan remain available.
4The live label is the current reference price. Closed charts replace it with the recorded exit.
What the view buttons do
Trade-first framing
Centers the entry and enough surrounding candles to understand immediate price behavior.
Near-term context
Shows the current day or recent week while preserving the trade markers.
Broader structure
Adds market context around the setup. It does not alter the recorded entry, stop or exit.
Zoom and pan
Drag or scroll to inspect detail. Collapse and reopen restores a valid viewport if the chart becomes too compressed.
08 / Price Ranges
Where price sits inside the daily action map.
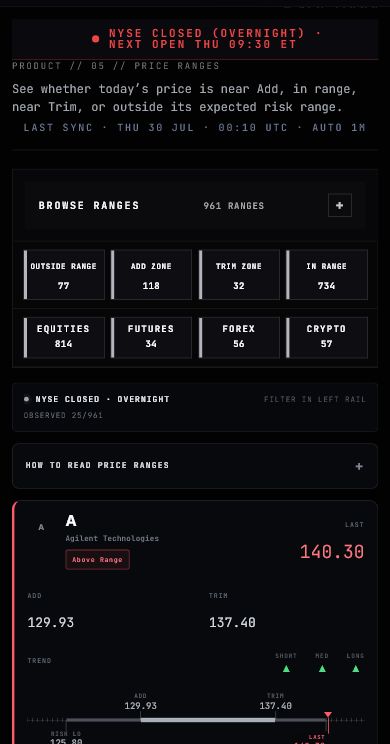
Price Ranges is a supporting market map. It is not another trade state and it does not replace the entry or stop on a live card.
Use the ticker selector to open one instrument, then read its last price, add zone, trim zone and outer risk boundary. The feed is edge-first so instruments outside or near their calibrated range are easier to find.
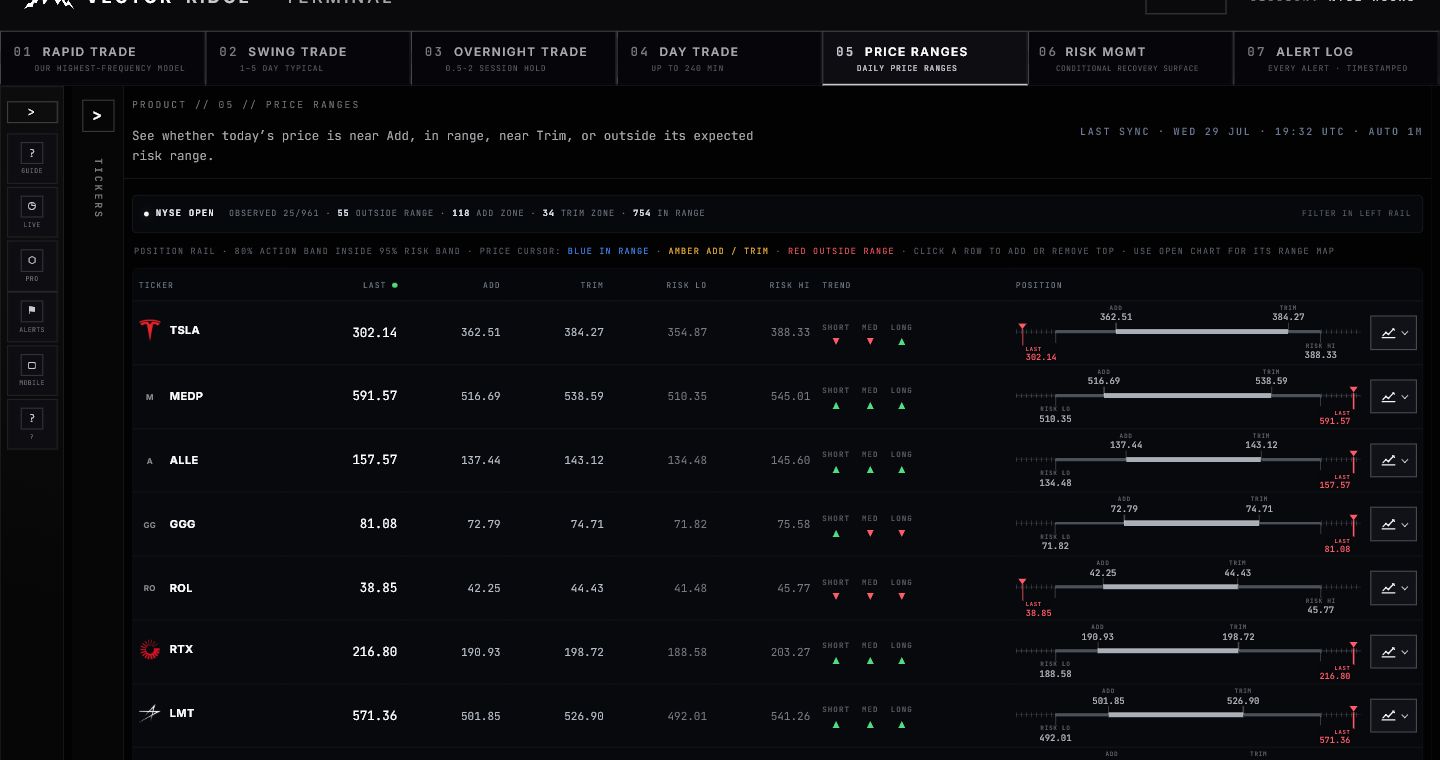
1Search or browse to select the instrument. Selection controls the full detail panel.
2The inner band contains the current add and trim references derived from the verified sheet.
3The outer boundary shows where price is beyond the calibrated range. It is context, not an automatic order.
09 / Risk Management
A probability surface projected onto price.
Risk Management asks what historically happened after price first touched a published depth, then places that conditional evidence beside the selected market. It supports a trade; it does not create one.
Select a ticker, target, first-touch depth and exact horizon, then read probability, confidence interval and sample size together. The chart keeps observed candles to the left of NOW and the deadline surface to the right; it is not an expected price path.
1The selected ticker and current context control the map. Never transfer a surface from one instrument to another.
2The selected outcome names probability, target, exact deadline, first-touch depth, confidence interval and sample size.
3Each deadline cell is discrete. The right-side terrain is a conditional probability surface, not a projected sequence of candles.
Keep the roles separate. The probability surface describes conditional risk. The trade card remains the authority for whether a position is open, updated or closed.
10 / Alert Log
Know what changed. Then verify what is true now.
The Alert Log is the timestamped event chronology. It answers what changed and when; the current trade card answers what is active now.
Alerts are events, not duplicate trades. A position can create a sequence such as BUY NOW → PROTECTED → LEVEL UPDATE → NEAR STOP → FLOOR EXIT. The newest alert appears first. Select a row to return to the owning product and, when the durable identity is exact, highlight the related trade.
1Your local display time is prominent; the smaller line preserves the originating market time.
2The action says what happened now: entry, event warning, stop change or close.
3Open the linked trade to see its current state and chart. The alert itself is an immutable historical event.
How to interpret common alert sequences
A
Entry event
BUY NOW or SELL NOW records the entry action. OPEN is the current economic state on the trade card.
B
Managed update
LEVEL UPDATE in the Terminal, NEW STOP on mobile and STOP UPDATED in push all describe a managed level change.
C
Final event
TARGET HIT, FLOOR EXIT, CLOCK EXIT, RISK EXIT or CLOSED records how the lifecycle ended. Performance holds the final result.
11 / Performance
From summary row to exact trade receipt.
Performance is the canonical closed-trade ledger. Expand any row to see the recorded entry, exit, duration, reason, product ownership and chart.
The top table is optimized for comparison: close date, product, symbol, grade, side, entry-to-exit and P&L. Sorting and filters change the view only. The economic trade ID ensures a native trade shown in Rapid is not counted twice.
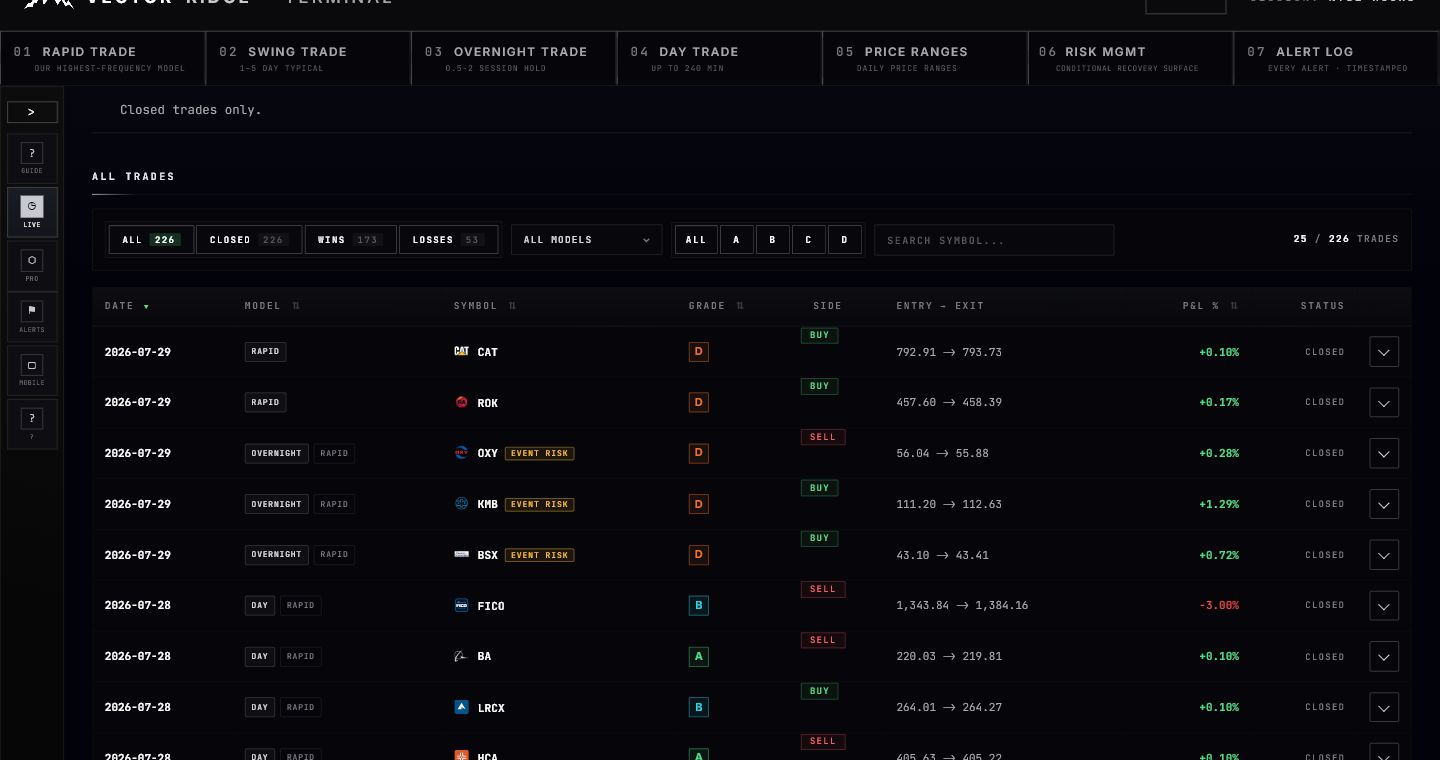
1Multiple product badges can describe one trade’s distribution, while the record remains economically unique.
2Entry → exit shows the two recorded prices before you open the detailed receipt.
3Expand the row for exact timestamps, close reason, evidence and the full chart.
The expanded record
The detail view places the trade journey above the chart: recorded entry, elapsed time, recorded exit and final result. Supporting fields include side, grade, close reason, event context, product membership and the stable economic trade ID.
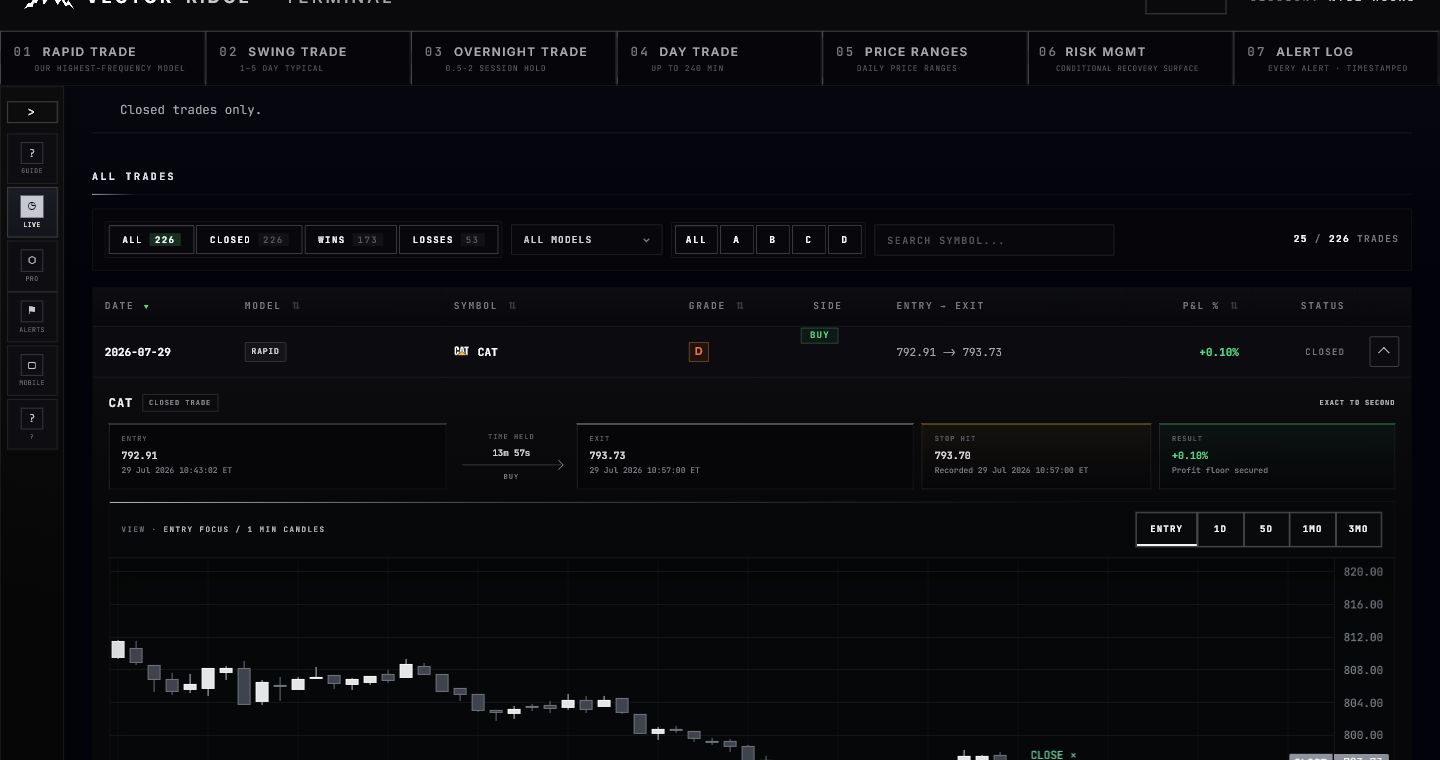
1The entry tile includes the recorded price and exact timestamp.
2Time held is calculated from the recorded entry and exit timestamps.
3The exit and result tiles preserve the final close price, P&L and close reason.
12 / Atlas
Ask questions without leaving the Terminal.
Atlas is a conversation-first research assistant. It can use bounded Terminal context when you ask about the selected product, symbol or card.
Use Atlas for two different jobs. Ask general trading questions directly, or attach the current Terminal context for product-specific guidance. Start a new chat when you want a separate conversation. Open the full AI Lab for deeper research and strategy work.
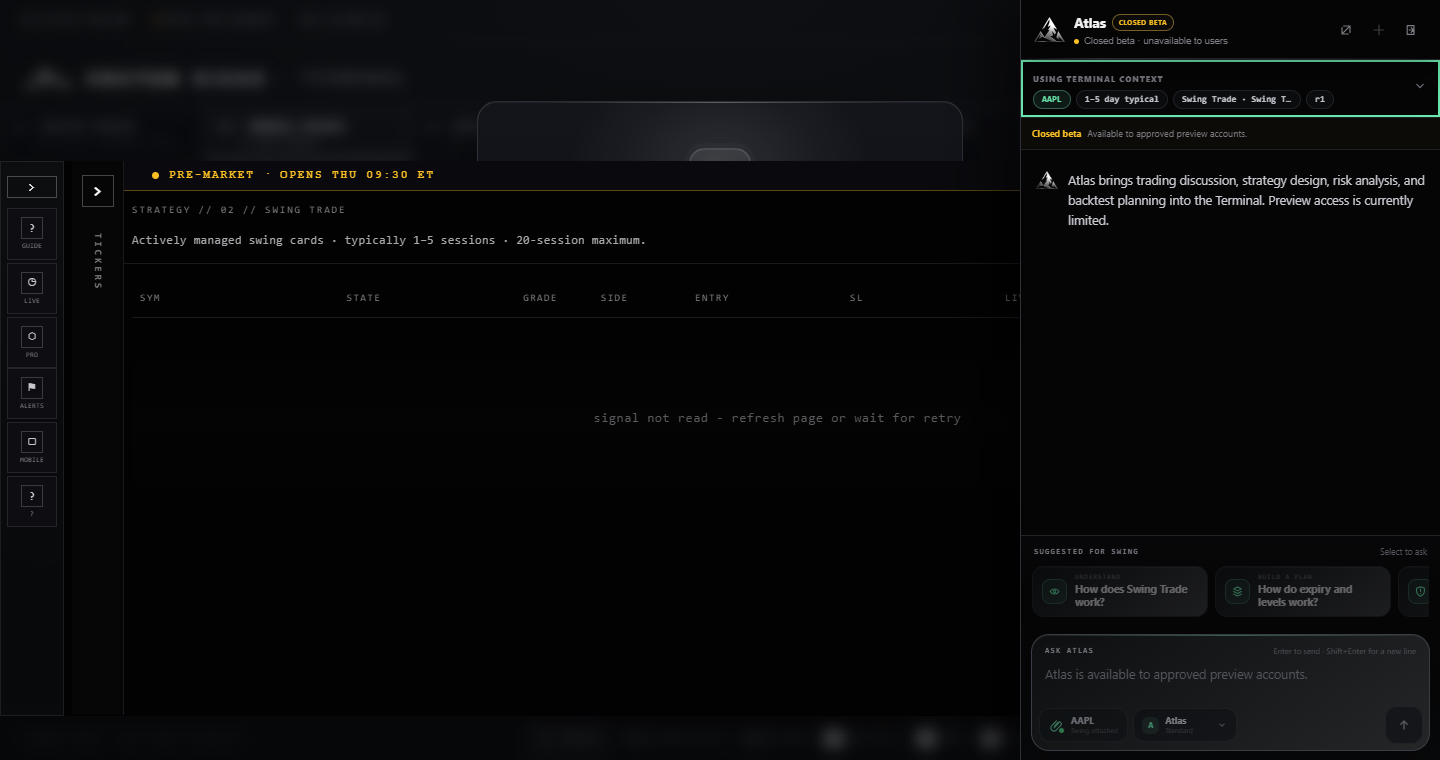
1The header shows the governed access state. Closed Beta remains limited to approved preview accounts.
2The context strip identifies the current navigation context. Treat it as a hint, never as a trusted live price, position or result.
3Use New Chat to isolate a fresh conversation. Open Full AI Lab when the task needs the wider research workspace.
4Suggested prompts are optional. Ask a direct question in the composer and keep follow-ups in the same thread.
Open the rail
Atlas opens beside the active board so the selected product remains visible while you ask a question.
Check the context chip
Attached Terminal context is a bounded navigation hint. It identifies what you are viewing without proving a live price or result.
Ask naturally
General trading questions do not require an upload or tool run. Product-specific questions can use the selected Terminal context.
Control the thread
New Chat creates a separate conversation. Open Full AI Lab when the work needs a wider research workspace.
Context is a navigation hint. Atlas must not treat a symbol, product, timeframe or selected card as trusted live price, position or performance evidence by itself.
13 / Alert setup
Make delivery work before the next signal.
The setup panel separates device permission, product selection and alert detail. Start Simple, then use Advanced only if you deliberately want to suppress a lifecycle category.
Open Alerts from the Terminal utility rail. Enable browser notifications, install the PWA on supported devices and choose the products that should reach this device. Simple keeps all five trade-update categories on. Advanced exposes New trades, Level changes, Near levels, Exits & closed and Event risk. The two modes edit one preference set.
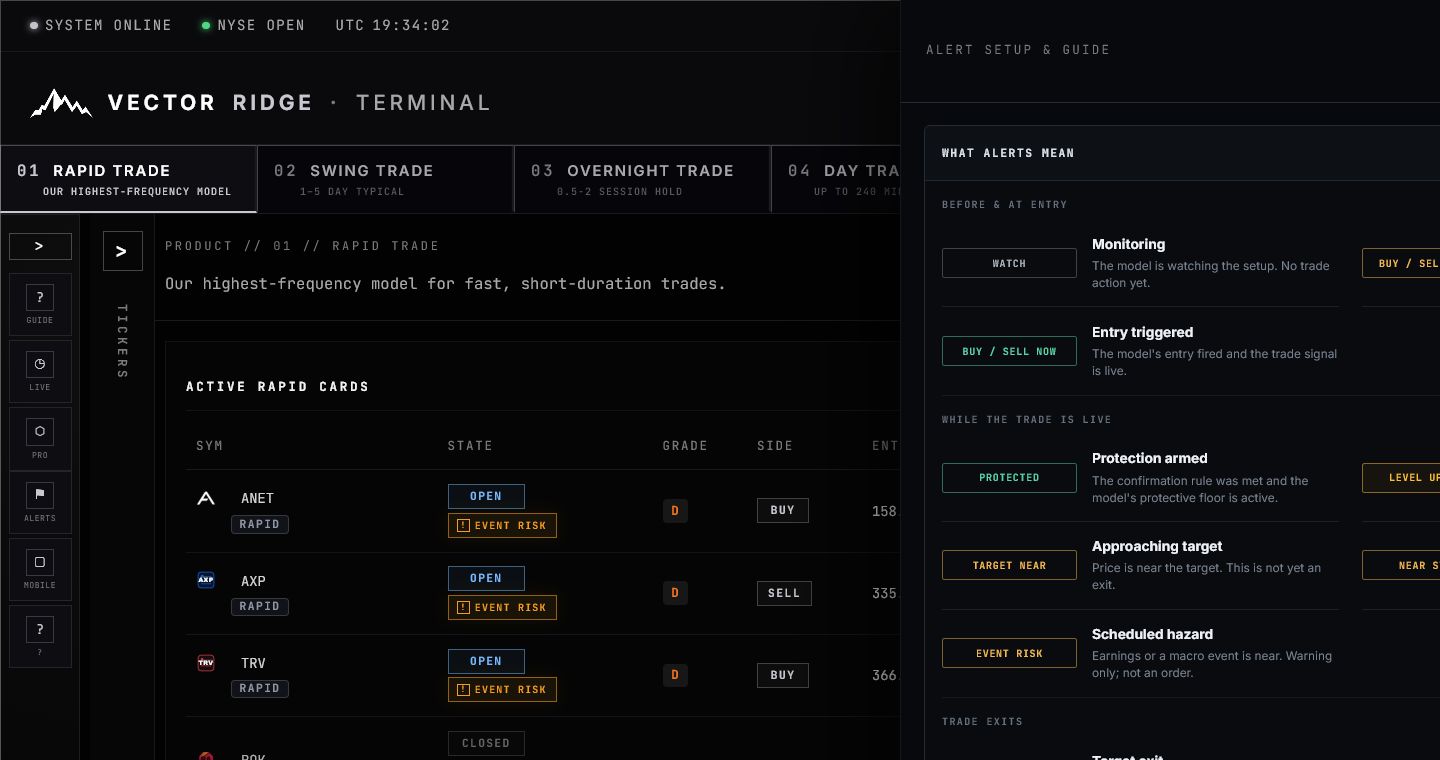
1The Alerts utility is the single entry point for setup, permission help and the test notification.
2Complete the steps on each device. Browser permission is device-specific.
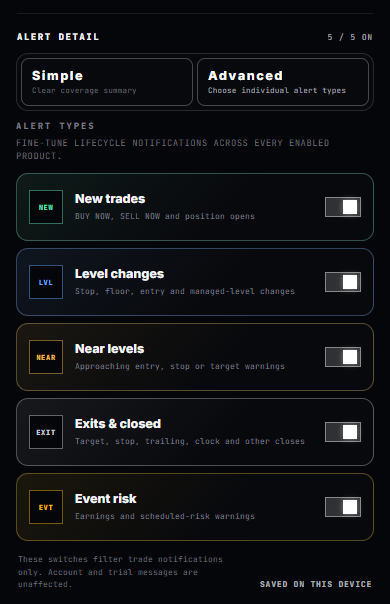
1Switching between Simple and Advanced changes the explanation, not the saved choices.
2Keep Level changes on when moved stops, floors or entries must reach the device.
3Keep Exits & closed on when you expect the final target, stop, trailing or clock event.
01
Allow notifications
Use the browser permission prompt. If previously blocked, re-enable notifications in the browser or operating-system settings.
02
Choose products
Day, Rapid, Swing and Overnight independently narrow delivery without changing account access.
03
Choose alert detail
Leave Simple on for complete coverage or use Advanced to review all five named lifecycle categories.
04
Verify the saved state
Confirm the device status and saved message. Feed filters are separate and cannot change push preferences.
14 / Mobile & PWA
The same lifecycle, redesigned for a phone.
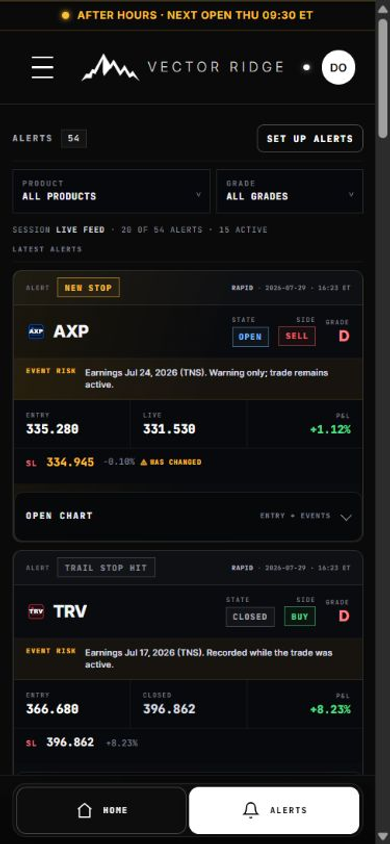
Mobile cards keep the product, alert action, state, side, grade, entry, live price, stop and P&L readable without a desktop table.
Use the mobile app for fast monitoring and alert follow-through. Product cards stack fields into clear blocks. The alert action sits at the top, the event warning gets its own strip and the chart remains one tap away. Opening the Alerts tab refreshes the feed so stale app state is less likely.
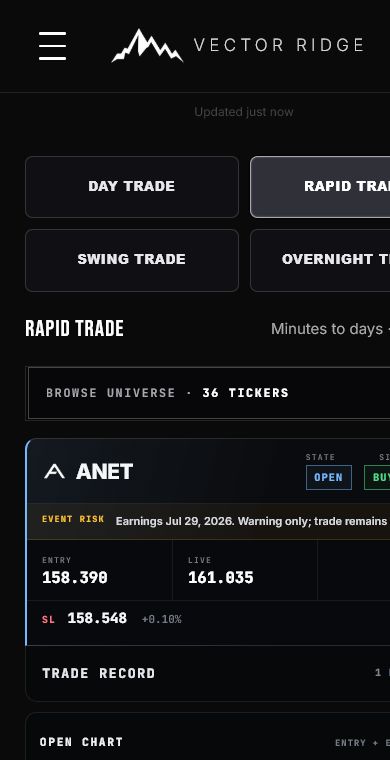
Phone workflow
01
Open the alert
Read the top action first: entry, stop update, near stop, event warning or close.
02
Confirm current state
Use the state badge inside the card. A TRAIL STOP HIT or CLOSED alert must show the position as closed.
03
Open the chart
Review entry, level changes and the current or closed price before returning to the feed.
15 / Reliability
Know what each surface can prove.
The Terminal is a research product. It records model states and prices; it is not a broker execution screen.
Source hierarchy
| Question | Use this surface | Why |
|---|---|---|
| Is the trade active now? | Current product card | The live card carries the newest lifecycle state and manager level. |
| What changed and when? | Alert Log | Every lifecycle event is timestamped and preserved in sequence. |
| Where did entry, stop or exit occur? | Expanded chart | Markers place the recorded levels on the candle history. |
| What was the final outcome? | Performance | The closed-trade ledger deduplicates economic identity and preserves the final receipt. |
| Where is price inside the daily map? | Price Ranges | The verified range sheet supplies action and outer-risk references. |
| How does conditional recovery change? | Risk Management | The probability surface adds scenario context without changing the trade state. |
Refresh deliberately. Each trade product includes a refresh control and a visible refreshed time. On mobile, opening Alerts refreshes the feed. If a notification and card disagree, use the newest live card and Alert Log sequence.
Common questions
Why is the live price neutral instead of green or red?
The price is a reference value, not the outcome. P&L carries the directional result. Closed prices are intentionally muted so open and finished trades cannot be confused.
Why did the stop turn yellow?
Yellow marks a newly published or changed manager level. Hover the warning when available or open the chart to see the update timestamp.
Why does the same ticker appear in Rapid and another product?
Rapid can distribute a native Swing, Overnight or Day position. Product badges show ownership, while the stable economic trade ID prevents duplicate performance.
Does Event Risk mean the trade will close?
No. Event Risk is a scheduled-catalyst warning. It remains attached to the trade after close for context, but it does not create or force an exit.
What if a chart looks compressed or partly blank?
Collapse and reopen it, then choose Entry focus. The chart resynchronizes after the row reaches full width while preserving valid manual zoom and pan.
Why can a phone alert arrive after the Terminal row changes?
The Terminal and push delivery are separate paths. Network and operating-system delivery can lag. The current card and Alert Log are the authoritative live sequence.
Ready
Open the Terminal with the whole system in view.
Choose the product, read the newest state, verify the chart and use Performance for the final record.