Start with every scheduled S&P 500 report
Date, before- or after-market timing, sector, and filters make the next relevant event easy to find.
 Vector Ridge
Event-risk calendar
Know what reports next, what analysts expect, and how far the market is pricing the stock to move.
Earnings starts with the full S&P 500 calendar, then lets you narrow to portfolio or watchlist names and open a complete preview for each report.
Inside Earnings
The next report is useful only when its timing, consensus, expected movement, portfolio exposure, and post-report conclusion stay connected.
Select a numbered point to trace the screen.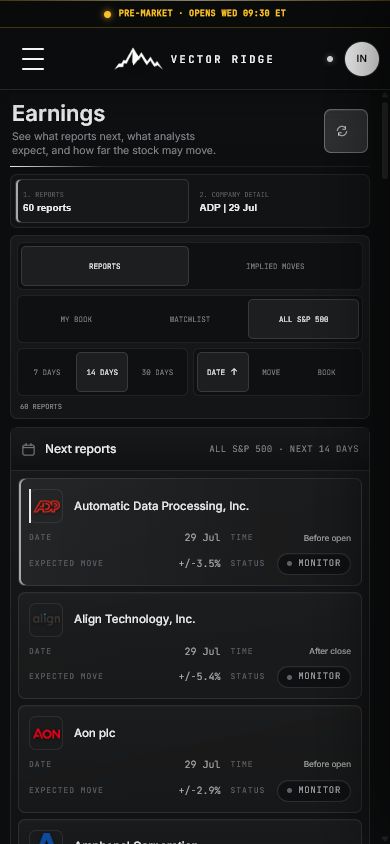
Why Earnings
Earnings combines the full S&P 500 calendar with analyst consensus, options-implied movement, portfolio exposure, and a post-report conclusion.
Date, before- or after-market timing, sector, and filters make the next relevant event easy to find.
Analyst estimates describe the expected business result; options pricing estimates how far the stock may move around the event.
Portfolio relevance, the decision checklist, verified results, price response, and what changed remain attached to the same company event.
Complete event-risk manual
Earnings begins with every upcoming S&P 500 report, then narrows by date, expected movement, or portfolio relevance. Each company view connects analyst expectations with the event's likely portfolio importance and reported outcome.
Product map
Move through the product in order. Each view has a distinct job and should not be used as a substitute for the next one.
Which companies report next and when?
What does consensus expect and what matters to the current view?
How large a move is the market pricing, regardless of direction?
What printed, how did price react, and what changes now?
Screen anatomy
The field, its meaning, and the decision it supports remain separate. This prevents a rank, forecast, range, or headline result from carrying more authority than it should.
The scheduled session and before-open or after-close timing.
Confirm timing close to the event because companies can change dates.
The current published analyst expectation.
Treat it as a moving baseline, not Vector Ridge's own forecast.
The spread of available estimates around consensus.
Use dispersion to understand disagreement before the report.
An absolute percentage magnitude around the event.
Do not read it as an up or down call.
Marks an options-derived expected move when verified.
Keep it distinct from a historical or model estimate.
The stock's typical recent daily movement.
Compare event pricing with ordinary volatility.
Shows whether the company appears in a current Vector Ridge product.
Prioritize preparation where the event intersects existing exposure.
Actual versus consensus, initial reaction, and thesis impact.
Replace the preview with this dated record after the event.
Interpretation states
A product state should lead to a specific research action, including the decision to do nothing when no new evidence deserves attention.
Repeatable workflow
The routine keeps the product useful after the novelty disappears. It also leaves a clearer record of what was known, what changed, and why a decision followed.
Start with All S&P 500 and choose the 7-, 14-, or 30-day window.
Sort by date for planning or expected movement for event-risk comparison.
Open portfolio and watchlist names first, then other reports with meaningful market read-through.
Record consensus, analyst range, expected movement, normal movement, timing, and the decision question.
Do not infer direction from the expected-move percentage.
After the report, compare actual results and guidance with the pre-event baseline and observe the market reaction.
Update the thesis or position only when the new evidence changes the original decision.
Plain-English glossary
Seven real product captures
Earnings keeps the calendar, analyst consensus, expected movement, portfolio exposure, and reported conclusion in one repeatable event workflow.
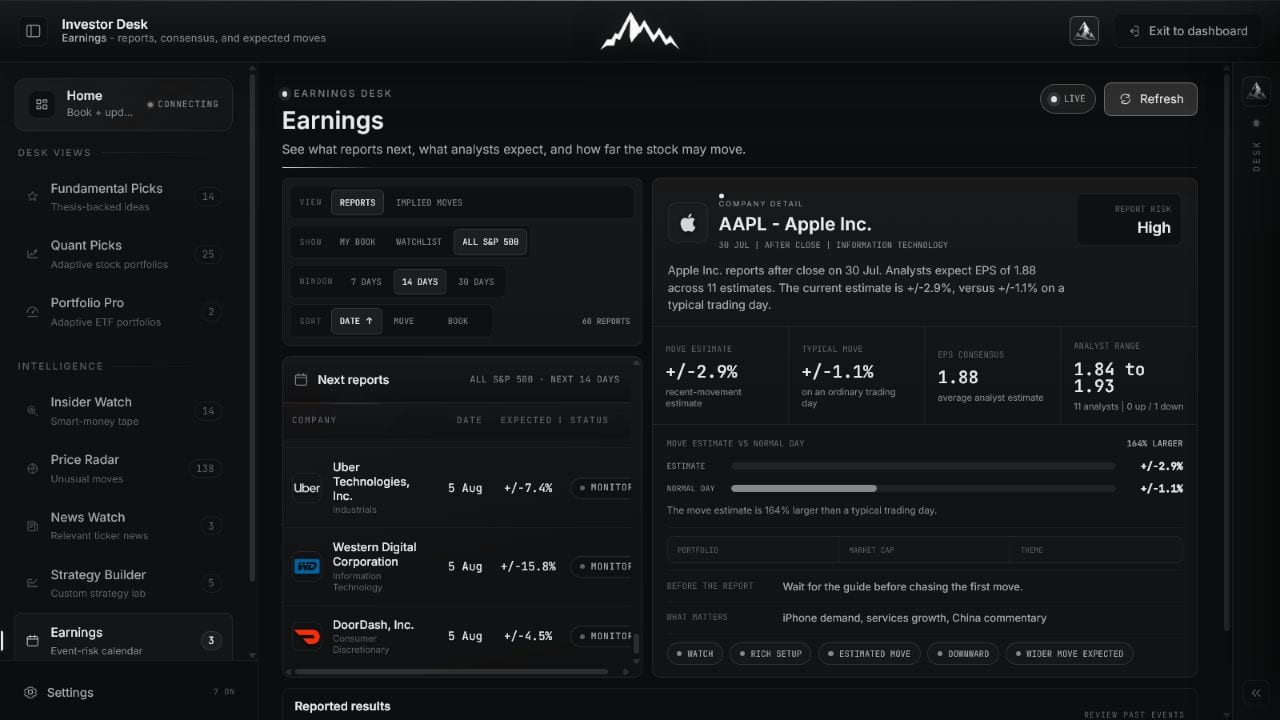
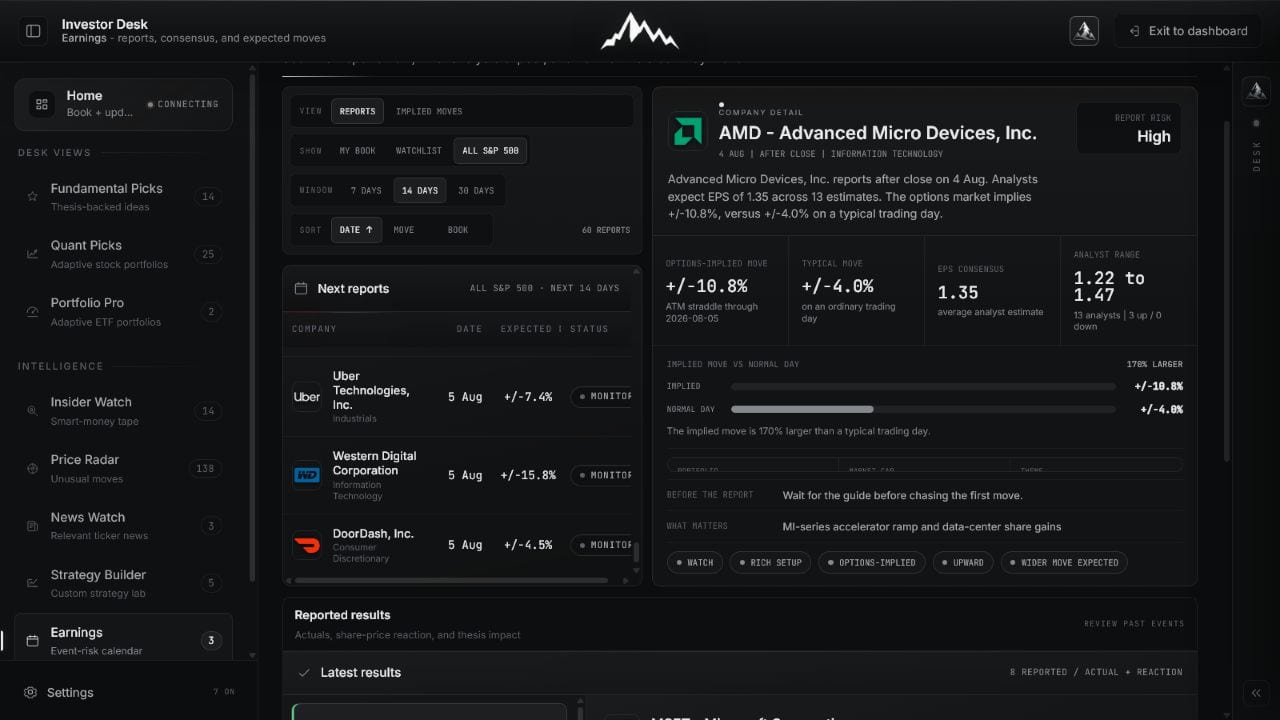
Filter the next 7, 14, or 30 days, change the sort, or narrow to the book and watchlist only when relevance matters more than breadth.
 Open full image
Use timing, expected movement, and exposure status to decide which reports deserve preparation.
The preview keeps analyst consensus, the published range, expected movement, normal movement, portfolio exposure, and the key question together.
 Open full image
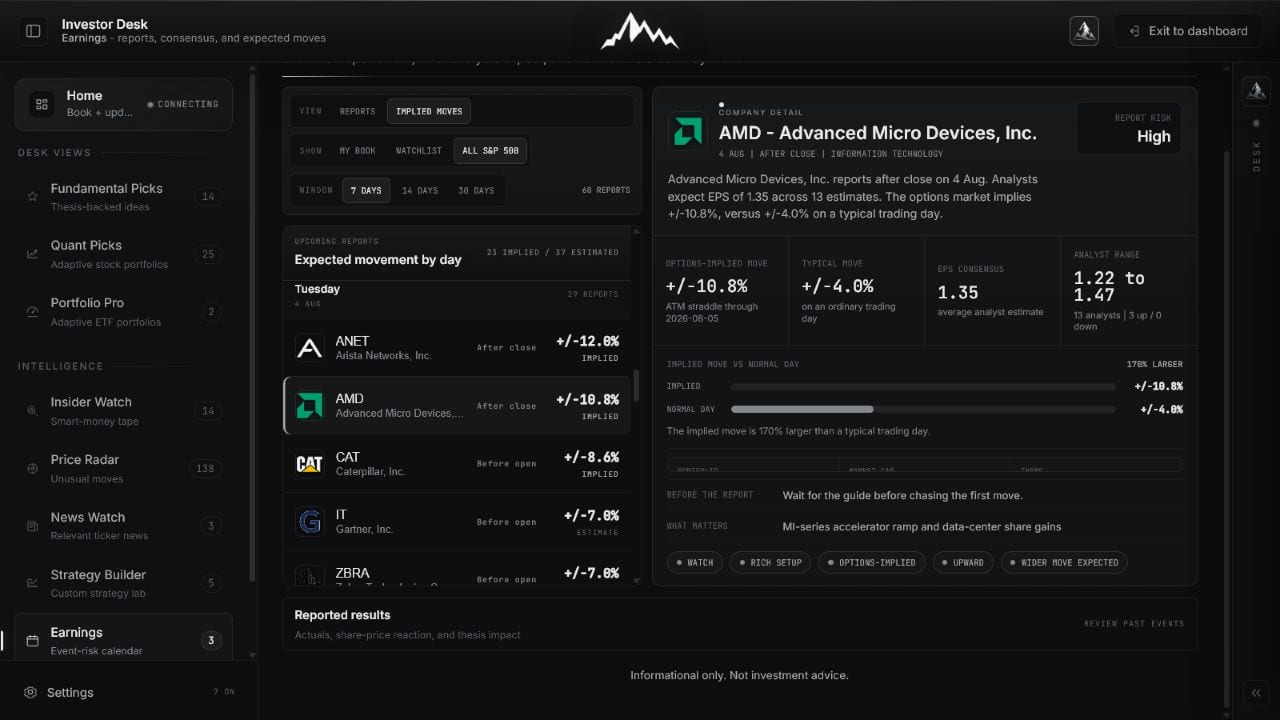
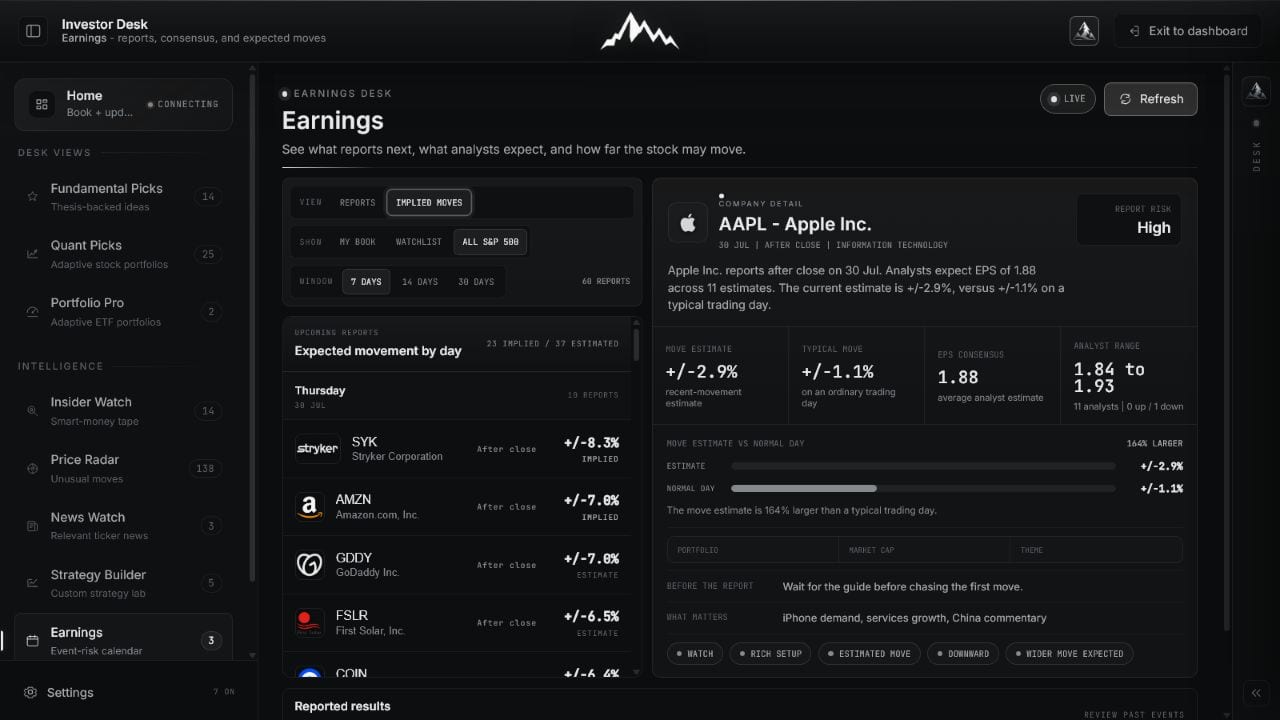
Expected movement describes magnitude, not direction. Read it beside consensus, exposure, and what matters.
The board labels options-derived implied movement distinctly. After the report, the review compares actual results with consensus and records the market reaction and thesis impact.
 Open full image
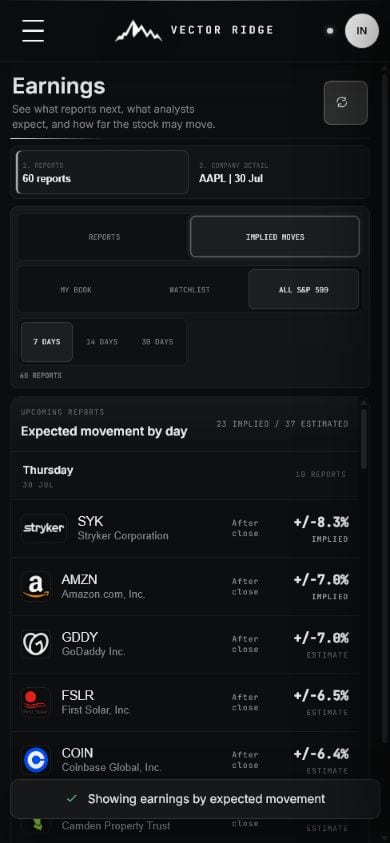
Compare event magnitude across the week without turning the number into a directional forecast.
 Open full image
Reconcile the print, surprise, reaction, thesis impact, and next action after the event.
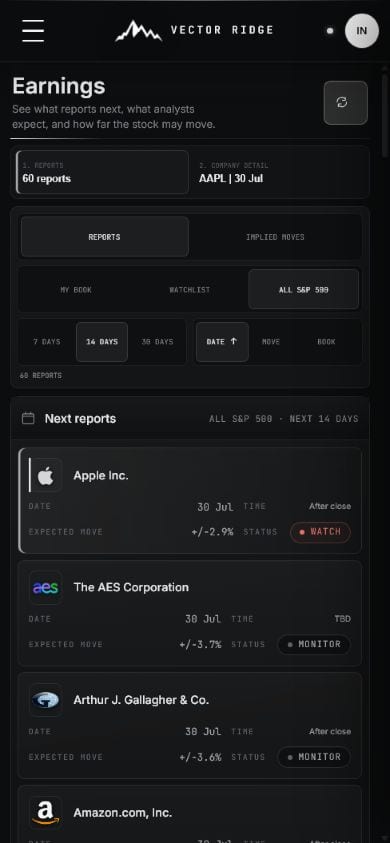
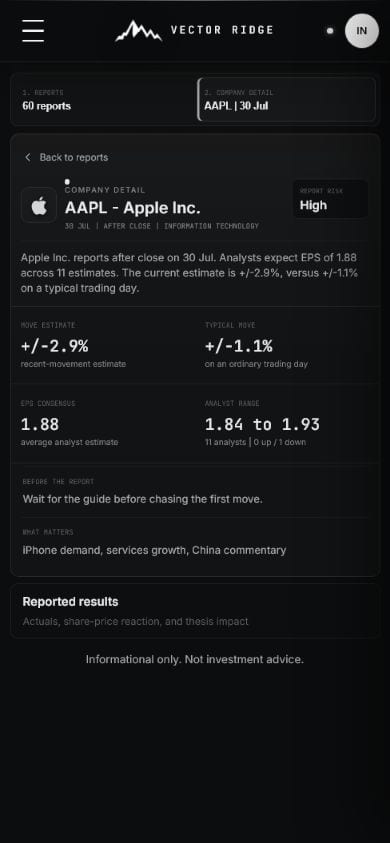
Mobile removes the desktop split view and presents one event at a time in the same preparation sequence.
 Open full image
Find the next relevant report.
 Open full image
Read consensus, event risk, and exposure.
 Open full image
Compare expected event magnitude across the week.
How to use it
Use the full S&P 500 calendar to find the event, open the company preview, confirm what is priced, then revisit the verified result.
Start with the next 14 days, then change the window or sort by date, expected move, or portfolio relevance.
Open the earnings preview for timing, consensus, expected move, normal daily movement, and portfolio status.
Review what matters, desk focus, and the checklist to complete before the release.
Compare actual results with consensus and read the dated conclusion and market response.
Earnings on mobile
Mobile keeps date, session, consensus, expected move, portfolio relevance, and the decision checklist attached to each company.
Example workflow
Expected move describes market pricing, not the direction of the move.
Confirm the report date and session
Review consensus and the expected move label
Check current portfolio exposure and what matters
Revisit the event after results for the conclusion
Updates and boundaries
Dates, consensus, and expected moves refresh as the report approaches. After the company reports, actual results and the conclusion replace the preview state when verified data is available.
Ready to use Earnings?
Use Earnings with its current data, controls, and saved account context.