Adaptive rather than permanently risk-on
Core Growth and Conservative can change ETFs, sleeve weights, and total equity exposure at the monthly review instead of holding a static allocation through every regime.
 Vector Ridge
Adaptive ETF portfolios
See what the portfolio owns now, and why it can adapt.
Portfolio Pro publishes two model ETF portfolios: Core Growth for compounding and Conservative for a calmer path, with current weights, historical stress behavior, and UCITS implementation alternatives.
Inside Portfolio Pro
The page connects the portfolio objective with the current ETF weights and the historical periods that show how adaptation behaved.
Select a numbered point to trace the screen.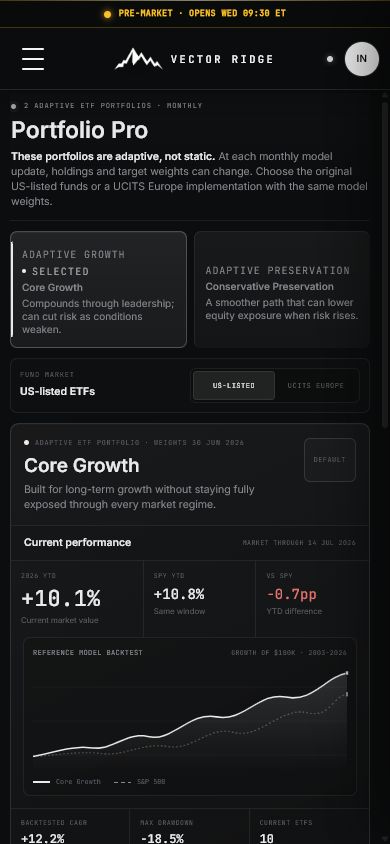
Why Portfolio Pro
Portfolio Pro is designed to pursue long-run growth while adapting exposure when volatility, breadth, and market risk deteriorate.
Core Growth and Conservative can change ETFs, sleeve weights, and total equity exposure at the monthly review instead of holding a static allocation through every regime.
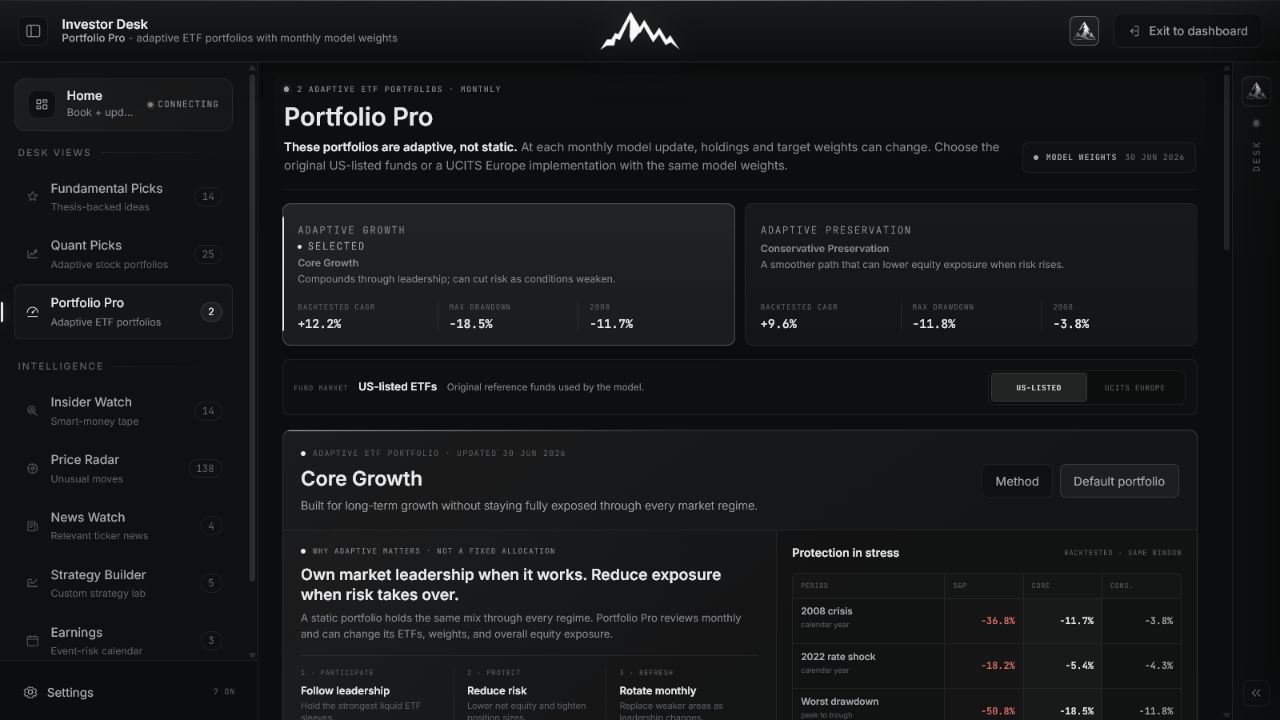
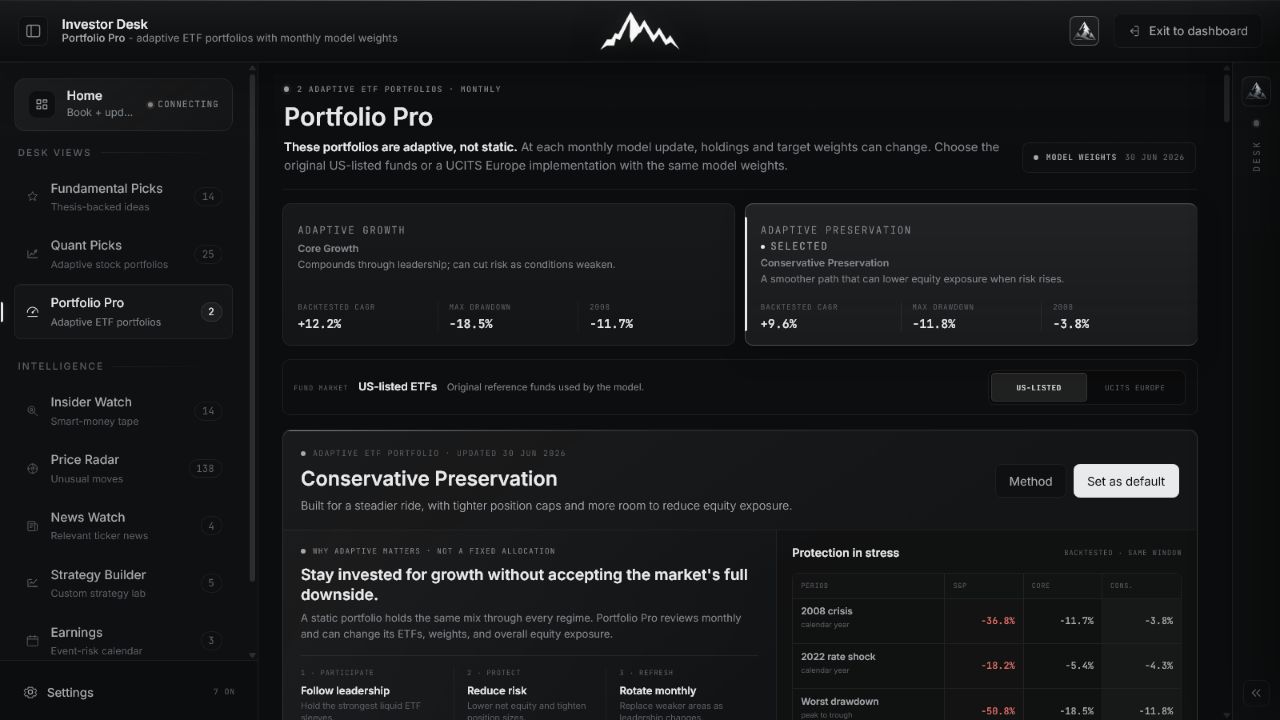
Core shows an -18.5% maximum drawdown and Conservative -11.8%, versus roughly -55% for the S&P 500 comparison. In 2008, the displayed returns are -11.7%, -3.8%, and -37% respectively.
Switch from the US-listed implementation to UCITS Europe to map the same model sleeves and weights to suitable European-listed ETF wrappers.
Portfolio results shown are historical simulations, not guarantees. UCITS wrappers can differ in fees, currency, domicile, liquidity, tax treatment, and tracking.
Portfolio Pro / Allocation system
Portfolio Pro publishes two complete ETF model portfolios. Each has a different job, but both can rotate holdings and risk at the monthly review. The current target weights are the product; individual funds are not standalone recommendations.
Monthly adaptive cycle
Adaptive does not mean constant trading or discretionary reaction to every headline. The model reviews the regime on its monthly cycle, builds a complete target allocation, and publishes one dated snapshot for the next period.
The monthly review evaluates leadership, breadth, volatility, and the market's broader risk condition.
Eligible equity, factor, sector, and defensive ETF exposures are compared using the current model state.
The selected sleeves receive target weights that together form the complete model portfolio.
When conditions weaken, the portfolio can change holdings, lower exposed equity risk, or favor more defensive sleeves.
The new model date, implementation, and full target weights replace the prior snapshot until the next published review.
Current allocation anatomy
The mandate, date, implementation, sleeve, and weight answer different questions. Check all of them before translating the model into an account, and never treat the highest-weight fund as the only important output.
Historical evidence
The stress table below reproduces the figures displayed in the product's historical simulation. It is useful because both portfolios and the S&P 500 use the same dated periods. It is not a promise that a future decline will look the same.
The displayed simulation reduced the depth of the equity-market decline in both mandates.
Both simulated portfolios adapted through a difficult inflation and rates regime.
Maximum drawdown shows the worst historical peak-to-trough path, not the loss limit for the future.
Portfolio and S&P 500 results should use the identical start and end date before any relative claim is considered.
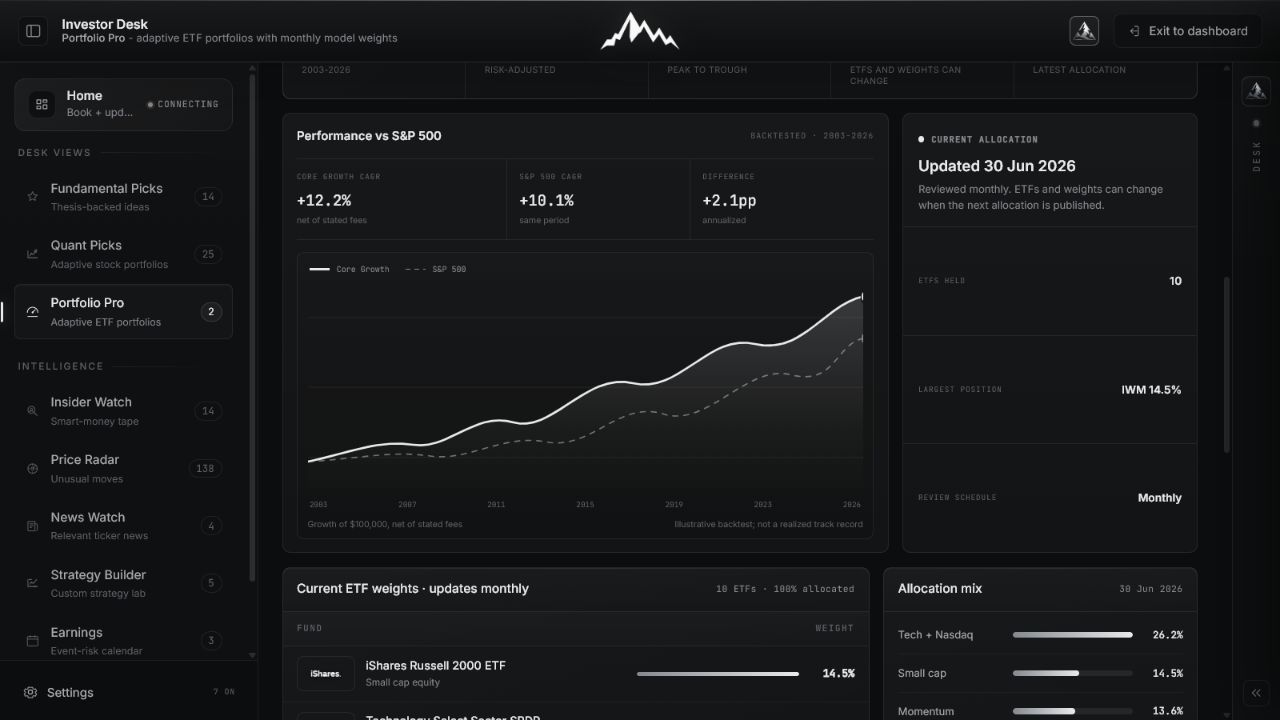
Annualized growth makes long periods comparable, but it does not describe the volatility or losses endured along the way.
Peak-to-trough loss is the clearest test of the downside design. It should be read with CAGR, not replaced by it.
2008, 2022, and other dated periods reveal how adaptation behaved when equity leadership or macro conditions changed.
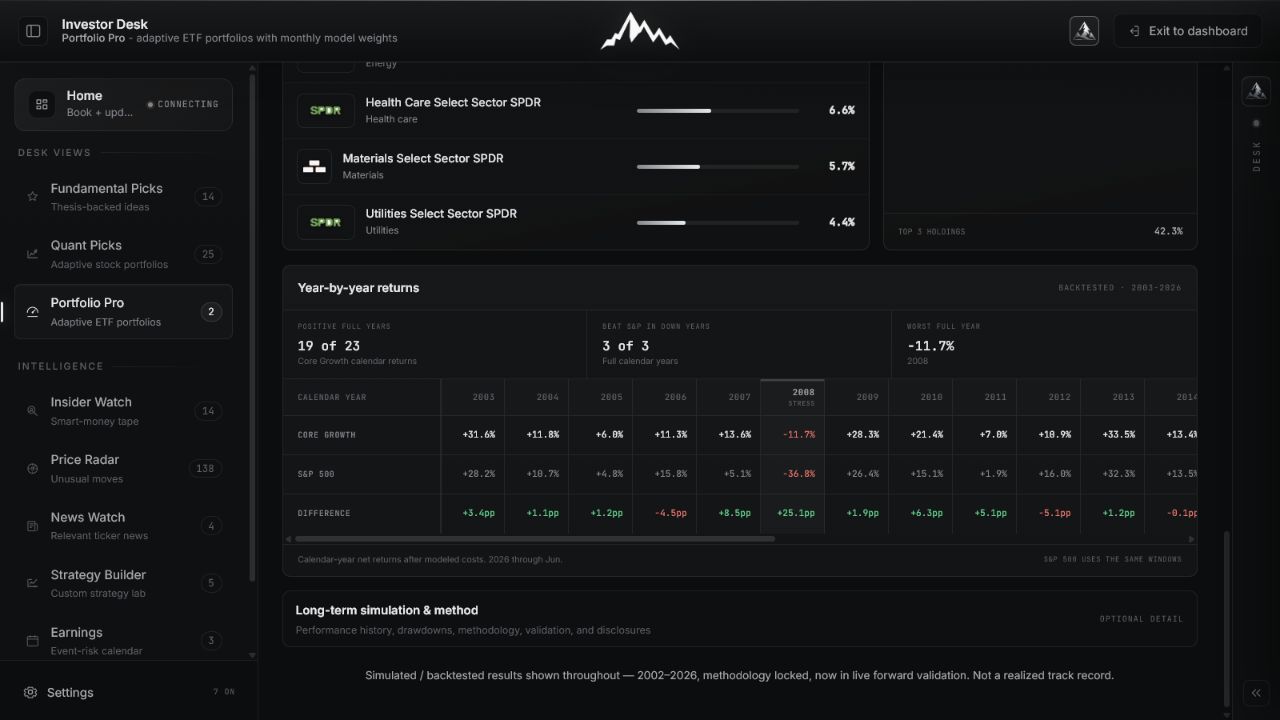
The annual table exposes the full path, including weak years, lagging years, and the periods when defense mattered.
Read model frequency, assumed costs, validation notes, and simulation status before treating historical evidence as investable experience.
U.S. and UCITS implementation
The implementation toggle does not create a third portfolio. It translates the selected Core or Conservative allocation into the wrapper set available to the account. Confirm the exact instrument before execution.
Shows the primary U.S.-listed ETF set and the exact target weights for the selected mandate.
Maps the same model sleeve and weight intent to suitable UCITS ETF wrappers for investors who cannot or do not want to use U.S.-listed funds.
The monthly implementation routine
The workflow is deliberately quiet between updates. Verify the new snapshot, calculate the differences, execute the correct wrappers, and preserve a record of any real-world divergence.
Choose Core Growth or Conservative from the objective and acceptable drawdown path, not the latest return leader.
Select U.S.-listed or UCITS Europe before reading tickers so the displayed wrapper set matches the intended account.
Verify the model date and confirm that the current snapshot is newer than the allocation you already hold.
Compare every target weight with the prior snapshot and calculate only the changes needed to reach the new model.
Confirm each fund identity, exchange, ISIN where applicable, spread, and trading currency before placing an order.
Record any execution difference, fee, tax constraint, or unavailable wrapper that makes the real account diverge from the model.
Hold the published allocation until a new dated monthly snapshot appears; ordinary market movement is not an instruction to improvise.
Seventeen real product captures
These are distinct states from the working Portfolio Pro surface: both mandates, their historical paths, the current U.S. and UCITS allocations, methodology, and the complete mobile workflow.
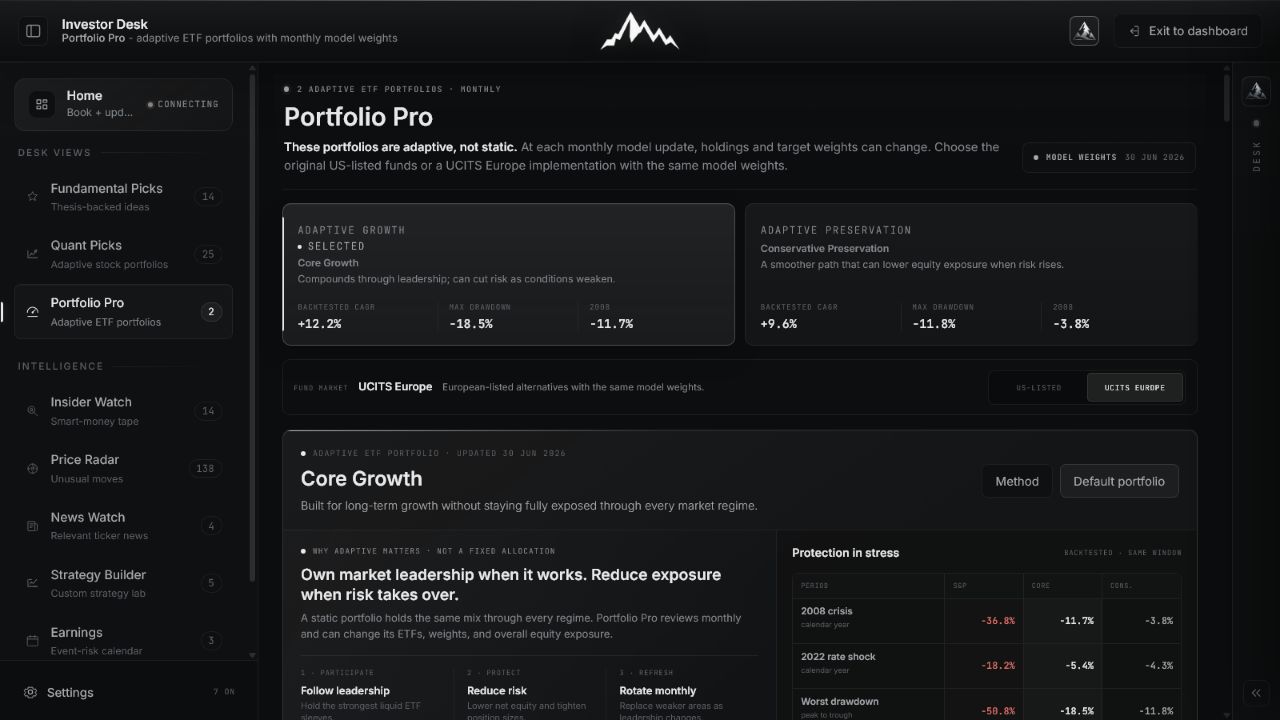
Core Growth and Conservative Preservation share an adaptive process but serve different objectives. Read the mandate and downside path before comparing returns.
 Open full image
Review the growth mandate, current model date, historical stress table, and adaptive design together.
 Open full image
Choose the calmer mandate when capital preservation matters more than maximizing upside capture.
The product keeps CAGR, maximum drawdown, same-window S&P comparison, annual returns, stress periods, and simulation assumptions connected to the selected mandate.
 Open full image
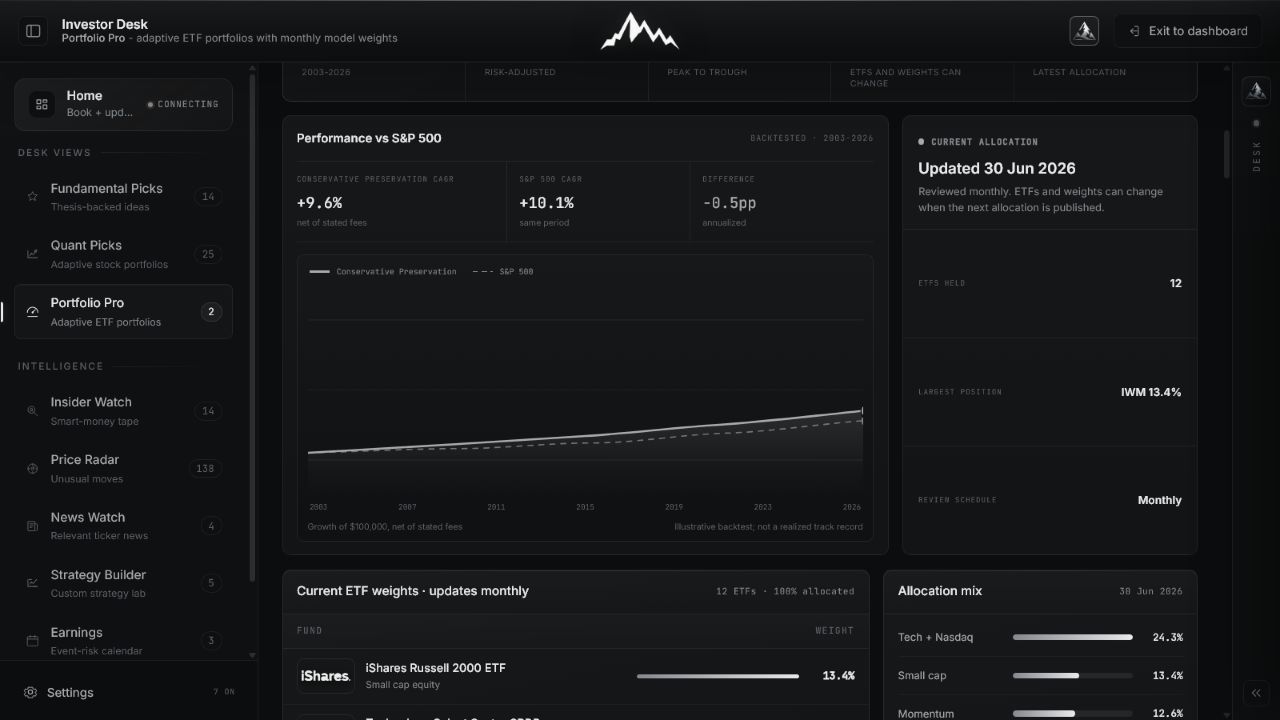
Read growth and drawdown together instead of treating the headline return as the whole result.
 Open full image
Compare the smoother simulated mandate with the same benchmark and market window.
 Open full image
Expose weak years, lagging years, and the periods when adaptation mattered rather than relying on one terminal number.
 Open full image
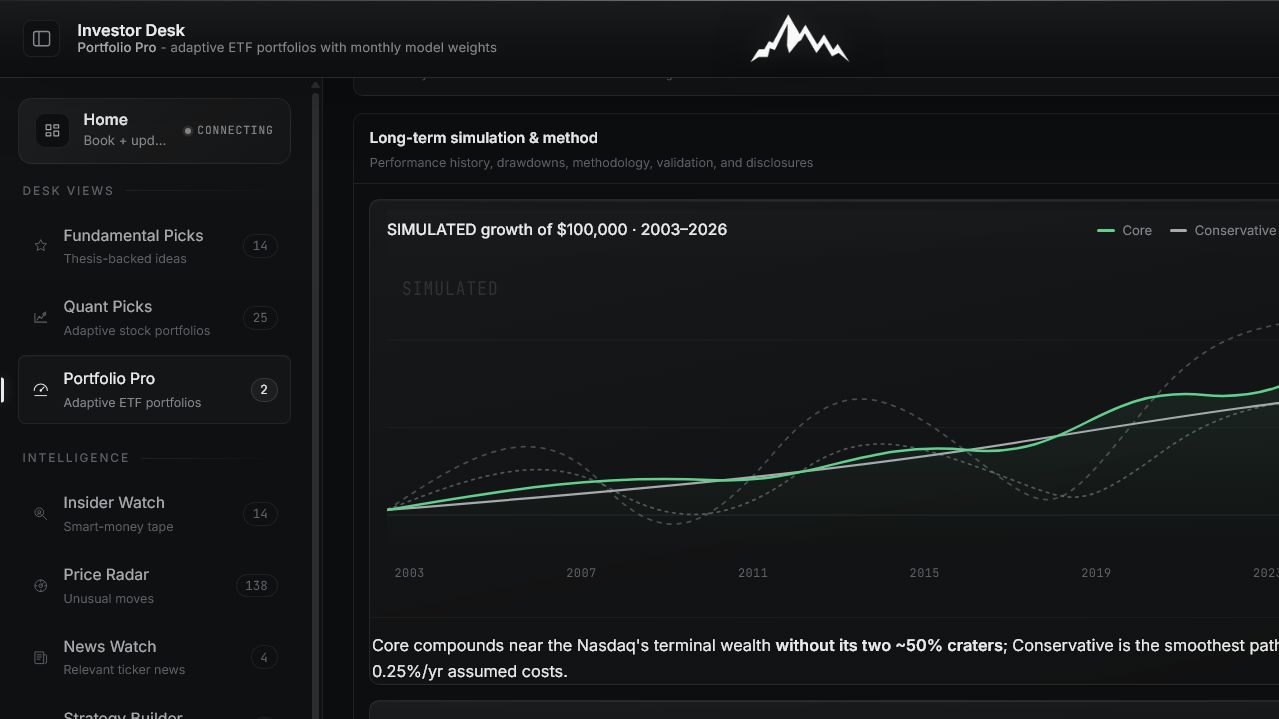
Confirm model frequency, assumed costs, validation notes, and simulation status before using the historical evidence.
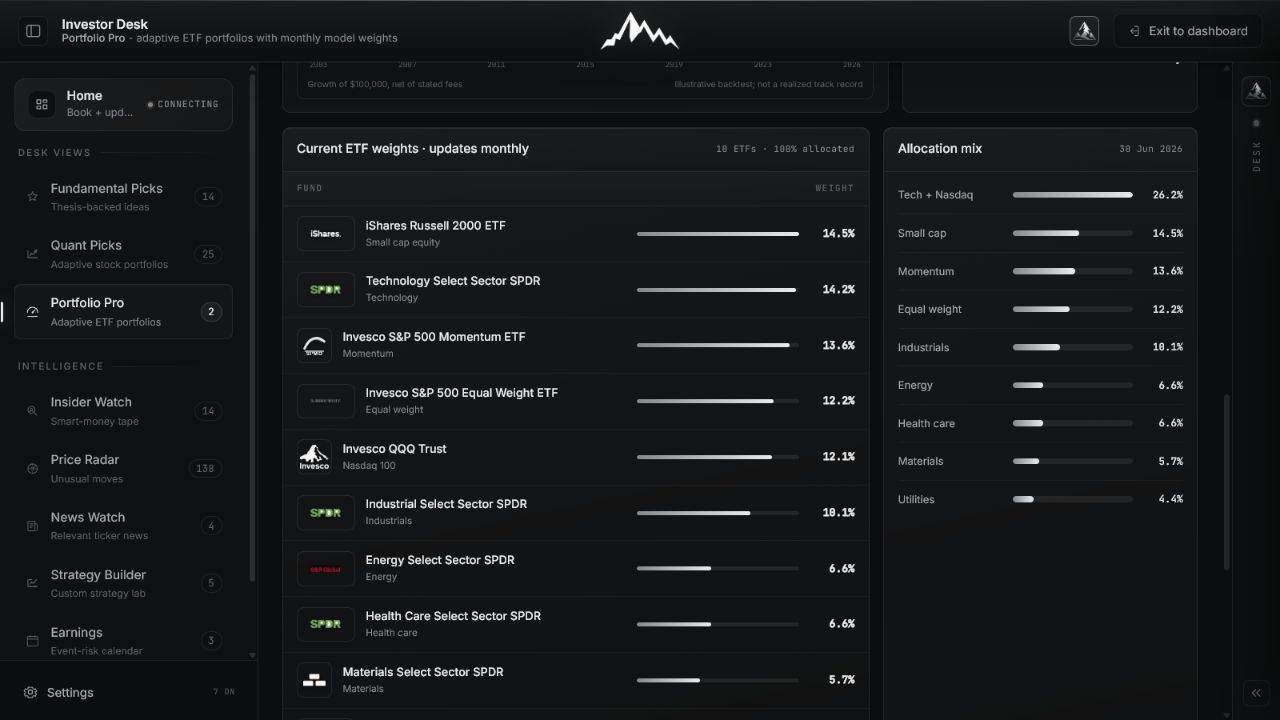
The U.S. and UCITS views preserve the portfolio's sleeve and weight intent while making the exact fund wrapper, effective date, and allocation visible.
 Open full image
Read every fund and weight as one complete model snapshot, not a menu of individual ETF ideas.
 Open full image
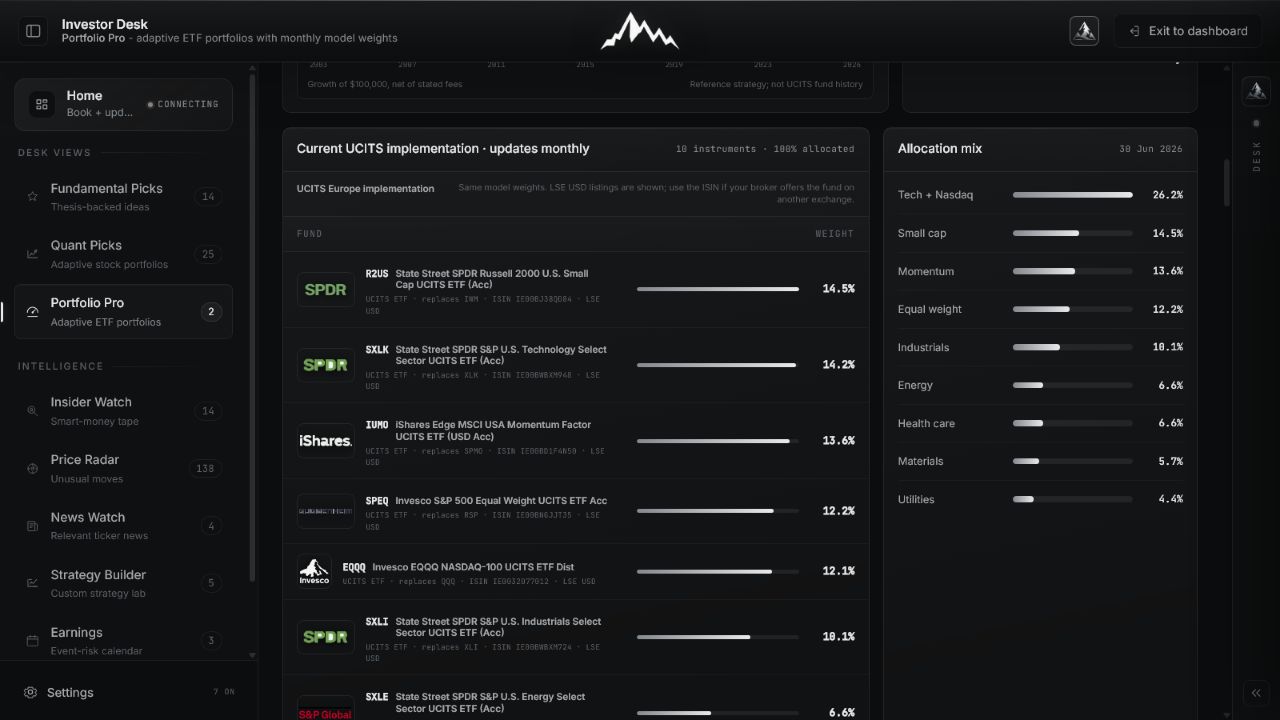
Keep the mandate and model weights while changing the fund-market implementation.
 Open full image
Use the exact fund name and ISIN because exchange tickers and trading currencies can differ by broker.
 Open full image
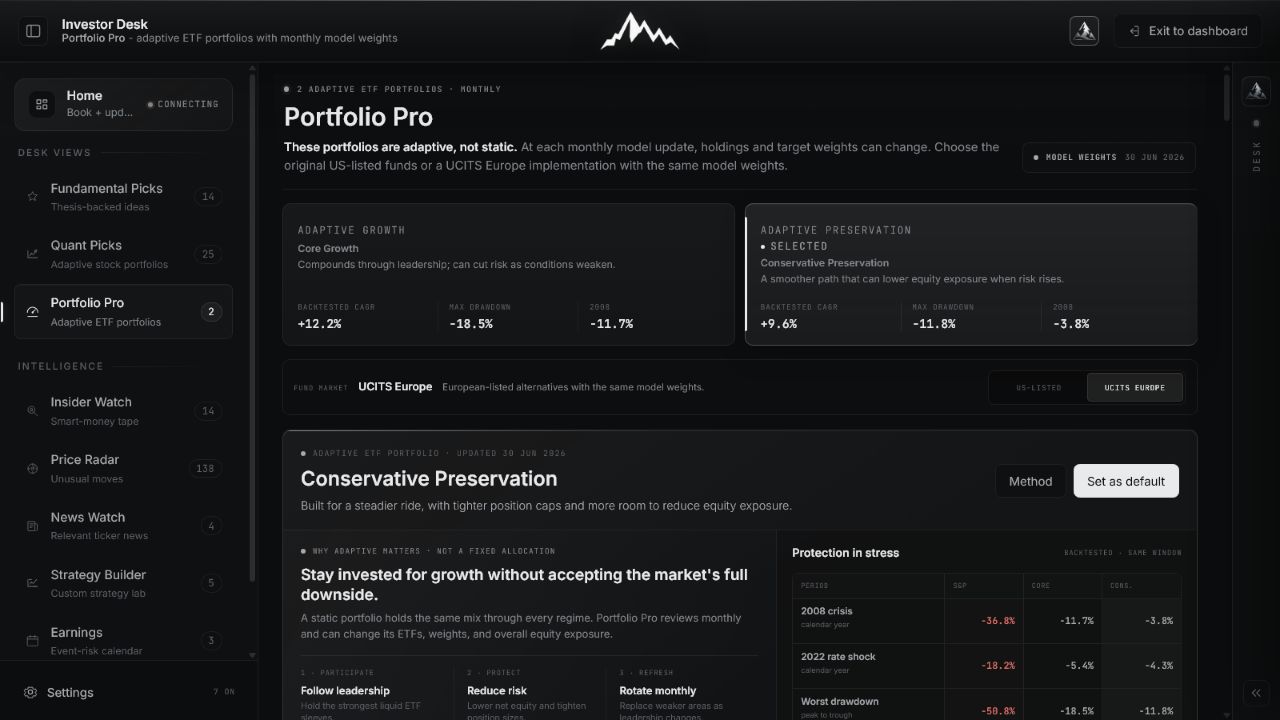
The preservation objective remains primary when the wrapper set changes.
 Open full image
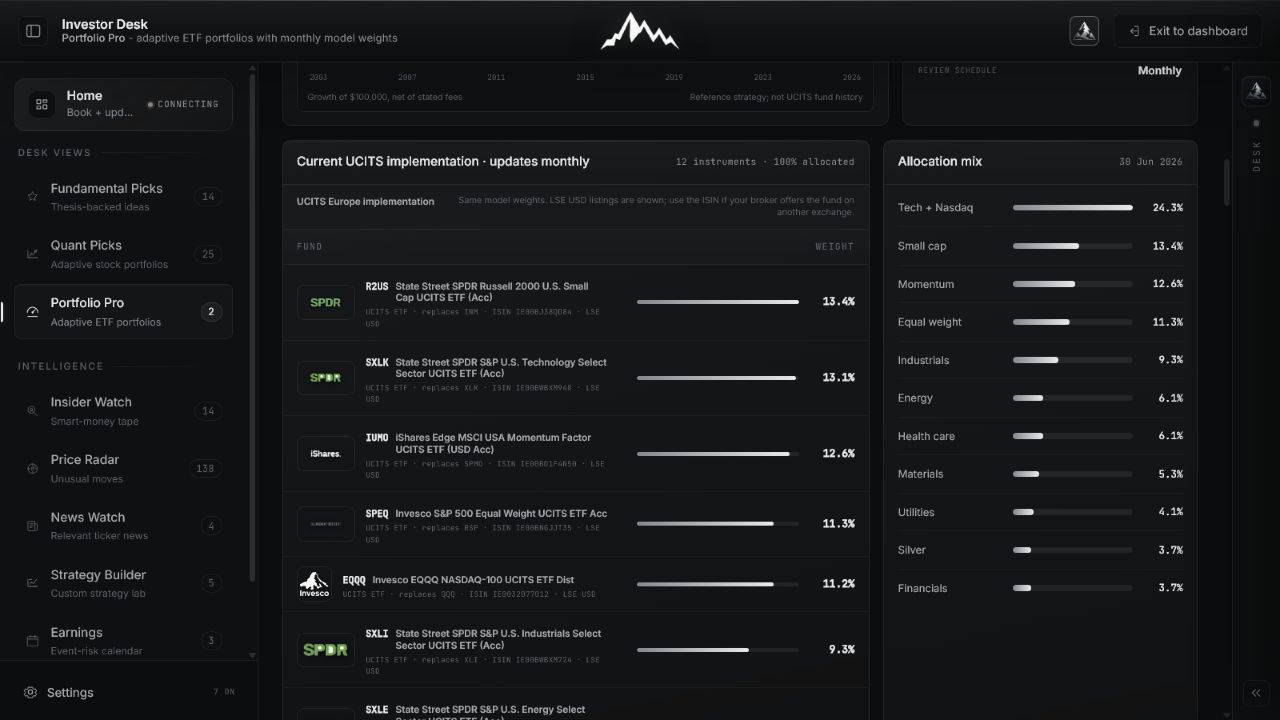
Verify the complete defensive allocation and effective date before translating it into an account.
The mobile path keeps mandate selection, implementation, current weights, stress evidence, and methodology in one vertical sequence without horizontal page scrolling.
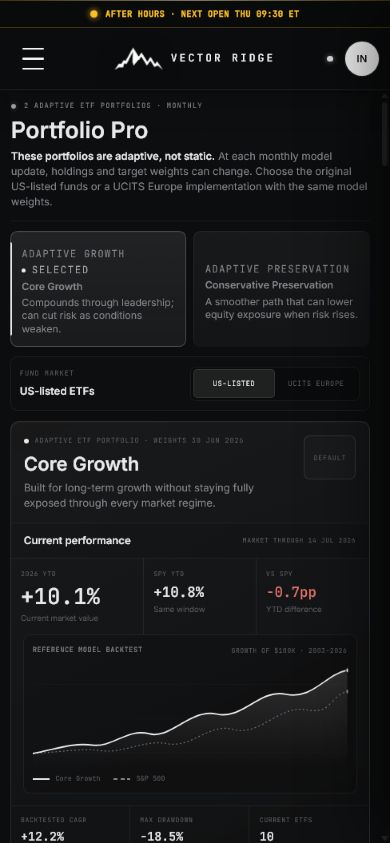 Open full image
Choose the mandate and see its current performance before moving into the allocation.
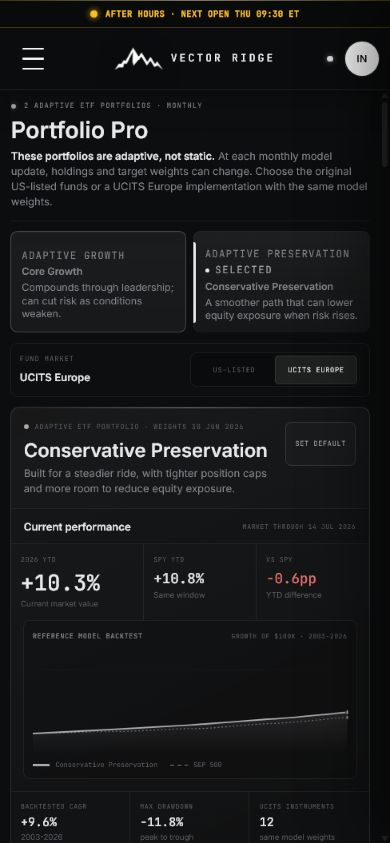 Open full image
Compare the preservation mandate without leaving the same product path.
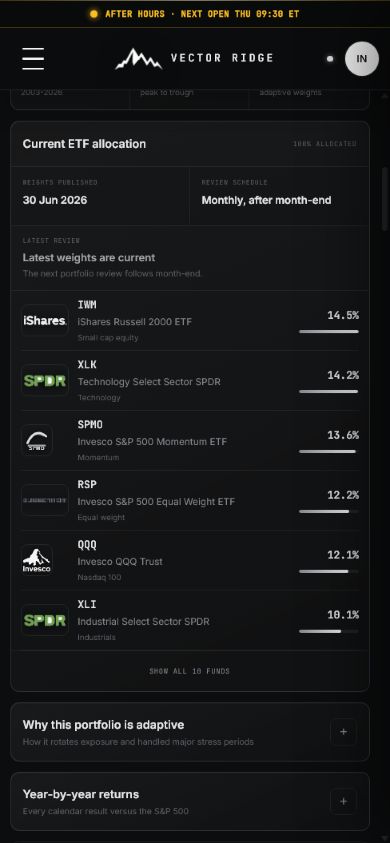 Open full image
Check the model date, review schedule, fund names, and target weights from the phone.
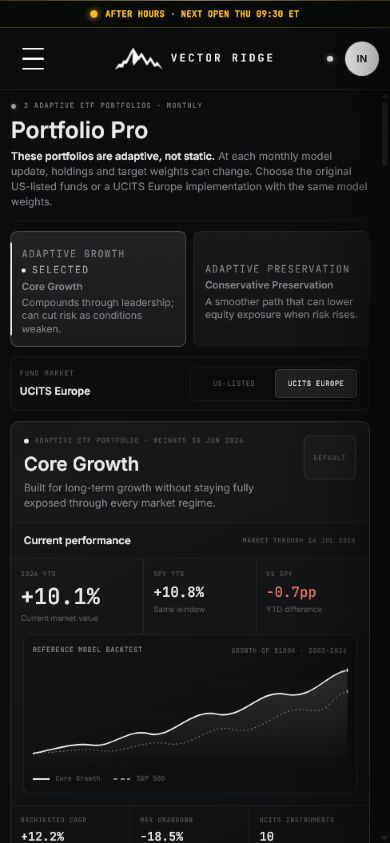 Open full image
Switch the fund market while keeping the selected portfolio objective visible.
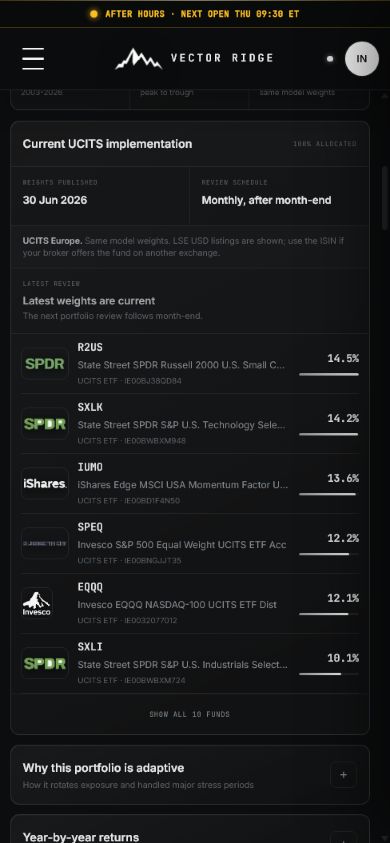 Open full image
Use the displayed wrapper and ISIN context to verify what the broker actually offers.
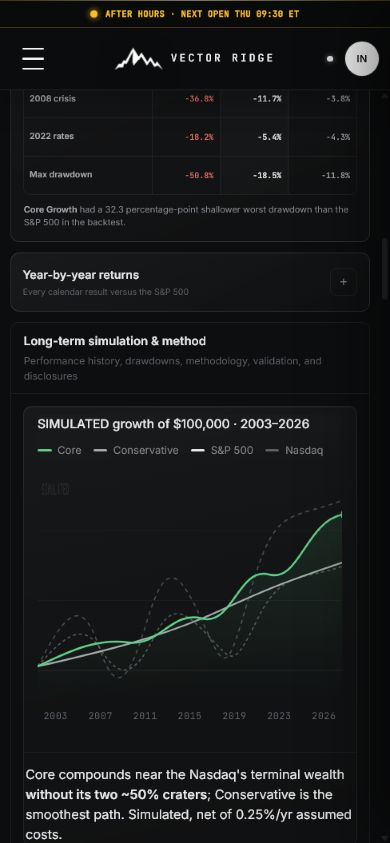 Open full image
Continue from the stress table into the full simulated path and its disclosure without changing screens.
How to use it
Start with the mandate. Only then compare current weights, implementation route, performance, and stress-period behavior.
Start with the objective and acceptable drawdown path, not whichever portfolio led most recently.
Review every ETF weight, sleeve, and effective model date. The weights together form the portfolio.
Compare growth, drawdown, annual returns, and stress periods with the S&P 500 over the same horizon.
US-listed and European UCITS views map the same portfolio intent to the available wrapper set.
Portfolio Pro on mobile
The mobile view keeps the portfolio mandate, latest allocation, performance path, and implementation choice in a compact reading order.
Example workflow
Portfolio Pro is adaptive allocation, not a fixed ETF basket.
Choose the growth or preservation objective
Review current weights and update date
Compare drawdown and stress behavior
Use the appropriate US or UCITS implementation view
Updates and boundaries
Core Growth and Conservative are reviewed on the model's monthly cycle. A new allocation replaces the prior model snapshot only when the dated update is published.
Ready to use Portfolio Pro?
Use Portfolio Pro with its current data, controls, and saved account context.