Vector Ridge
Investing involves substantial risk of loss. Past performance does not guarantee future results. Full disclaimer

Unusual move monitor

Price Radar

Find the moves that are unusual for the stock, not just large on a screen.

Price Radar compares each stock with its own normal movement and trading activity, then ranks the names most worth reviewing across portfolios, watchlists, major companies, and market ETFs.

Use it when
A stock or ETF moved far more than is normal for that instrument.
Start with
Priority moves
Leave with
Abnormality, exposure relevance, range context, and the next check

Inside Price Radar

Separate abnormal moves from ordinary volatility.

Relevance comes first: the move, the stock's usual behavior, your exposure, and the current Vector Range are read together.

Select a numbered point to trace the screen.
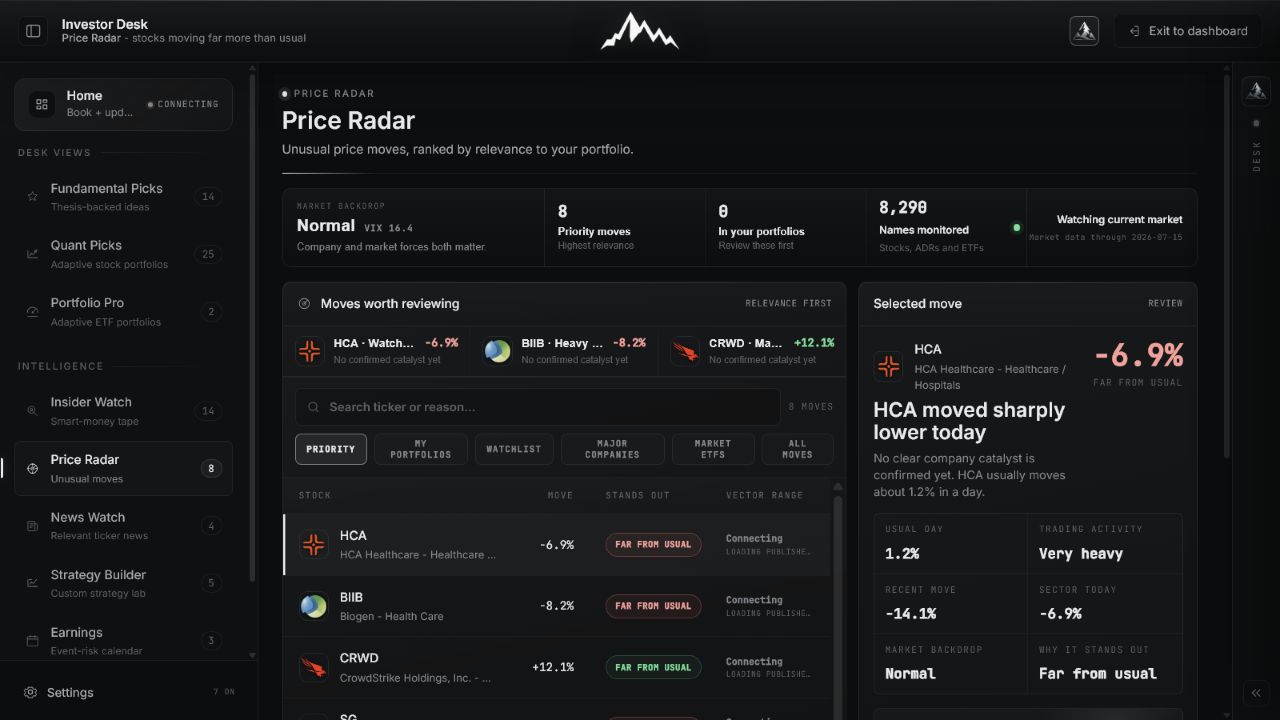
Price Radar shown in the Investor Desk interface
Current Price Radar interface. Select a point above or open the full screen. Displayed names and values can change as the product updates.
Current product screen Price Radar
Price Radar full product interface

Why Price Radar

Know which market move actually deserves your time.

Price Radar compares every move with the instrument's own normal behavior, then prioritizes names connected to your portfolios and watchlist.

01 · Noise filter

Abnormality is measured stock by stock

A 3% move can be routine for one company and exceptional for another. Price Radar judges each move against its usual range and activity.

02 · Exposure first

Your holdings and followed names rise to the top

Portfolio, research, and watchlist overlap determine what deserves review before broad-market movers.

03 · Decision context

Vector Range shows where price sits now

The current range, recent move, market backdrop, trading activity, and latest evidence stay attached to the selected stock.

Complete product manual

Price Radar / Decision architecture

One move. Five questions before you act.

Price Radar is not a conventional percentage-gainers list. It compares each security with its own normal behavior, adjusts the review threshold for the market regime, prioritizes names connected to your work, locates price inside the latest Vector Range, and routes the event into research.
01 Priority Daily queue
02 Relevance Your exposure
03 Context Why it stands out
04 Range Where price sits
05 Research What changed
Price Radar desktop screen with the five review zones marked 12345
Price Radar screen map. Start with relevance and abnormality, then move into context, range, and research.
  1. 01

    Read the market backdrop

    The VIX regime changes how selective the radar should be. In calm markets, isolated shocks stand out more; in stressed markets, portfolio risk and broad-market linkage come first.

  2. 02

    Start with the priority count

    Priority is the short review queue after abnormality, volume, market regime, and Vector Ridge relevance are combined. It is intentionally much smaller than the monitored universe.

  3. 03

    Choose the relevant universe

    Use portfolios and watchlist for owned or followed exposure, major companies for liquid leaders, Market ETFs for broad context, and All moves only for wider discovery.

  4. 04

    Compare the row, not just the return

    Read move, normal daily movement, trading activity, why it stands out, and Vector Range position together. A large move can be ordinary; a smaller move can be exceptional.

  5. 05

    Open one move and finish the check

    The selected panel turns the row into a review: recent path, sector move, market backdrop, exposure tags, current range, news, research, and a clear next action.

Relevance filters

Choose the question before you choose the stock.

Filters do not alter the measured move. They change which names reach the screen first, so an exposure check, a watchlist review, and broad-market discovery do not compete in one noisy list.

01Priority

What deserves attention first?

Best use
Default daily queue
Includes
Names clearing the current abnormality threshold, ranked with portfolio, watchlist, liquidity, and market relevance.
Boundary
Priority means review first, not buy or sell.
02My portfolios

Did anything I hold move unusually?

Best use
Exposure-first triage
Includes
Companies and ETFs connected to current Vector Ridge model portfolios.
Boundary
A quiet state is a valid result when no holding clears the threshold.
03Watchlist

Did a followed company change enough to revisit?

Best use
Research monitoring
Includes
Companies the user has deliberately followed across Investor Desk.
Boundary
Following a company does not imply an active position or thesis.
04Major companies

Which liquid market leaders are behaving abnormally?

Best use
Large-company discovery
Includes
Economically important, widely traded companies across major regions and sectors.
Boundary
Size and familiarity do not confirm the cause of a move.
05Market ETFs

Is the move visible in the broader market?

Best use
Cross-market confirmation
Includes
Broad, regional, sector, style, and thematic exchange-traded funds.
Boundary
ETF behavior is context; it does not prove the same driver applies to every holding.
06All moves

What else is moving across the monitored universe?

Best use
Deliberate broad discovery
Includes
The complete surfaced move queue after baseline data-quality checks.
Boundary
Use after relevance views; the wider list contains more noise and more names with no active research connection.

Move anatomy

Read eight facts before assigning a story.

The session return is only the first observation. The selected panel explains whether the behavior is unusual, whether participation confirms it, whether the market shares it, and where delayed price sits inside the published range.

01Move
The current session change. It is the observation, not the conclusion.
02Usual day
The security's own typical daily movement, used instead of a universal percentage cutoff.
03Vs normal
How many times larger the current move is than the security's usual behavior.
04Trading activity
Whether volume confirms broad participation or the price move is occurring on lighter activity.
05Recent move
The cumulative short-horizon path, which helps distinguish a one-day shock from an extended move.
06Sector today
The relevant sector or peer backdrop, used to test whether the shock is isolated or shared.
07Market backdrop
The current VIX regime and whether market-wide volatility is amplifying company moves.
08Vector Range
Where delayed price sits relative to the latest published risk low, buy zone, action band, trim zone, and risk high.

Adaptive market threshold

The same stock move means less when everything is moving.

Price Radar uses four VIX regimes to change the abnormality floor and the first review action. The regime does not predict direction; it controls how much broad-market volatility should influence triage.

Regime VIX range Priority floor Market read Review first
Calm VIX below 15 Priority starts around 2.5x normal Company-specific moves stand out more. Check the company catalyst and stock-specific evidence.
Normal VIX 15 to below 20 Priority starts around 2.2x normal Company and market forces both matter. Compare company news with sector and index behavior.
Elevated VIX 20 to below 30 Priority starts around 1.8x normal More stocks are moving together. Review owned names first and separate broad pressure from company evidence.
Stressed VIX 30 or higher Priority starts around 1.5x normal Market-wide swings are dominating. Start with portfolio risk, liquidity, and cross-market confirmation.

Vector Range interpretation

Abnormality and range position are separate signals.

Price Radar answers, “Is this move unusual for the security?” Vector Range answers, “Where is delayed price relative to the latest published market map?” Read both before deciding whether the event changes research or exposure.

01 Below range
02 Buy zone
03 In range
04 Trim zone
05 Above range
01Below range

Below the published outer risk low

What it says
The move has pushed price beyond the lower boundary of the current market map.
What to do next
Verify the live price and range receipt, then check catalyst, liquidity, corporate actions, and thesis damage.
02Buy zone

Between risk low and action low

What it says
Price is below the action band but remains inside the published outer range.
What to do next
Treat the label as market context. Confirm the thesis, timing, sizing, and current evidence before any action.
03In range

Between action low and action high

What it says
Price remains inside the current action band even if the session move is statistically unusual.
What to do next
Investigate the reason and decide whether the event changes the thesis rather than reacting to the percentage alone.
04Trim zone

Between action high and risk high

What it says
Price is above the action band but remains inside the published outer range.
What to do next
Review sizing, catalysts, and whether the move has pulled forward expected upside.
05Above range

Above the published outer risk high

What it says
The move has pushed price beyond the upper boundary of the current market map.
What to do next
Verify the receipt and catalyst, then reassess risk, position size, and whether the range has become stale.

Important: “Buy zone” and “Trim zone” are labels in the published daily market map. They are not individualized instructions, fundamental price targets, or substitutes for thesis, risk, liquidity, and sizing work.

Worked interpretations

Similar percentages can require different conclusions.

These patterns show why Price Radar combines security-specific behavior, exposure, market regime, and Vector Range instead of ranking stocks by raw return alone.

01

Large decline, still in range

Observed
The stock is moving several times more than usual, but delayed price remains inside the action band.
Check
Confirm the news, compare with sector performance, inspect volume, and read whether the recent path already reflected the concern.
Conclusion
The event deserves research, but the dramatic daily percentage has not by itself broken the current market map.
02

Positive shock in the Buy zone

Observed
The stock rallies sharply from below the action low while remaining inside the outer range.
Check
Verify whether the catalyst is durable, whether peers confirm it, and whether the fundamental or quant evidence has changed.
Conclusion
The move may improve the setup, but the Buy zone label and unusual return are context, not an automatic entry.
03

Portfolio name outside range

Observed
A held company crosses an outer risk boundary on heavy trading.
Check
Verify data quality first, then open current research, news, range receipt, and exposure before judging the position.
Conclusion
This is a high-priority portfolio review because exposure and market-map breach overlap; the required output is a documented decision, not a reflex trade.
04

Broad ETF shock in a stressed market

Observed
A market ETF and many constituents move together while VIX is above 30.
Check
Compare regions, sectors, rates, liquidity, and portfolio concentration before assigning company-specific causes.
Conclusion
Treat the event as market-wide risk first. Individual stock moves need stronger evidence before being called idiosyncratic.

The complete review routine

Move from shock to documented decision.

The product is most useful when every surfaced move receives the same evidence sequence. This prevents a red or green percentage, an assumed catalyst, or a stale range from becoming the decision.

  1. 01

    Open Priority and read the market backdrop before interpreting any individual percentage move.

  2. 02

    Switch to My portfolios and Watchlist to clear owned and followed exposure before broad discovery.

  3. 03

    Select the highest-relevance move and compare the session return with the security's usual daily behavior.

  4. 04

    Check trading activity, recent path, sector performance, and broad-market direction to test whether the shock is isolated.

  5. 05

    Read the current Vector Range position and verification date; keep abnormality and range location as separate facts.

  6. 06

    Open company news and research. If no catalyst is confirmed, retain that uncertainty instead of inventing a reason.

  7. 07

    Decide whether the event changes the thesis, position review, watch status, or nothing, then mark the item reviewed.

  8. 08

    Revisit only when price, volume, range position, market regime, or underlying evidence changes materially.

Visual product guide

Nineteen real product captures

See the move, the context, and the next research action.

These are distinct states from the working product: the live priority board, every relevance filter, calm portfolio output, positive and negative shocks, all five Vector Range positions, market-regime context, expanded company research, and the complete mobile workflow.

01 / Daily radar

Start with a ranked market, not an undifferentiated movers list.

Priority compares the size of each move with that security's own normal behavior, then adds trading activity, market regime, product exposure, watchlist relevance, and current Vector Range position.

Price Radar desktop overview with priority moves and a selected company review Open full image
01
Priority board

Scan only the moves that clear the current relevance and abnormality threshold, then open one name without losing the ranked list.
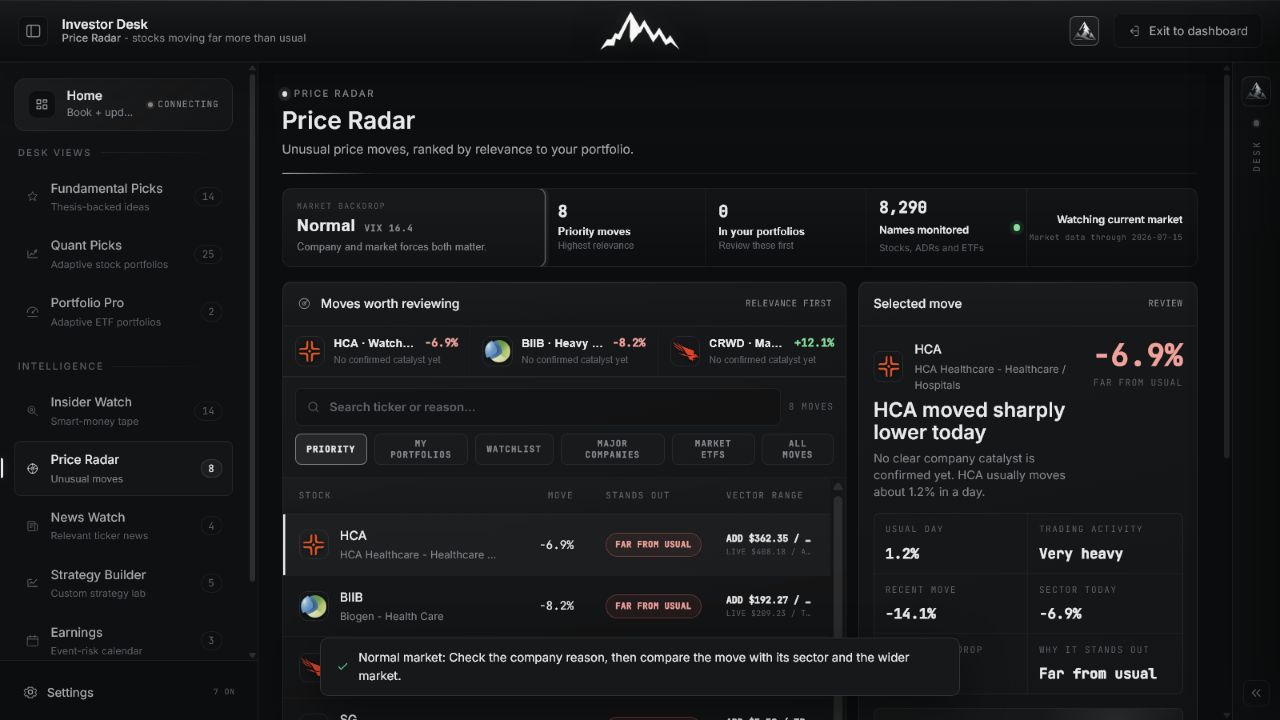
Price Radar market backdrop explanation with VIX regime context Open full image
02
Market backdrop

Use the current VIX regime to decide whether a move is more likely to be company-specific or part of broad market stress.

02 / Relevance filters

Change the question without changing the underlying evidence.

The same move can matter very differently depending on whether the company is held, followed, systemically important, or simply part of broad discovery. Filters change the review queue; they do not change the measured move.
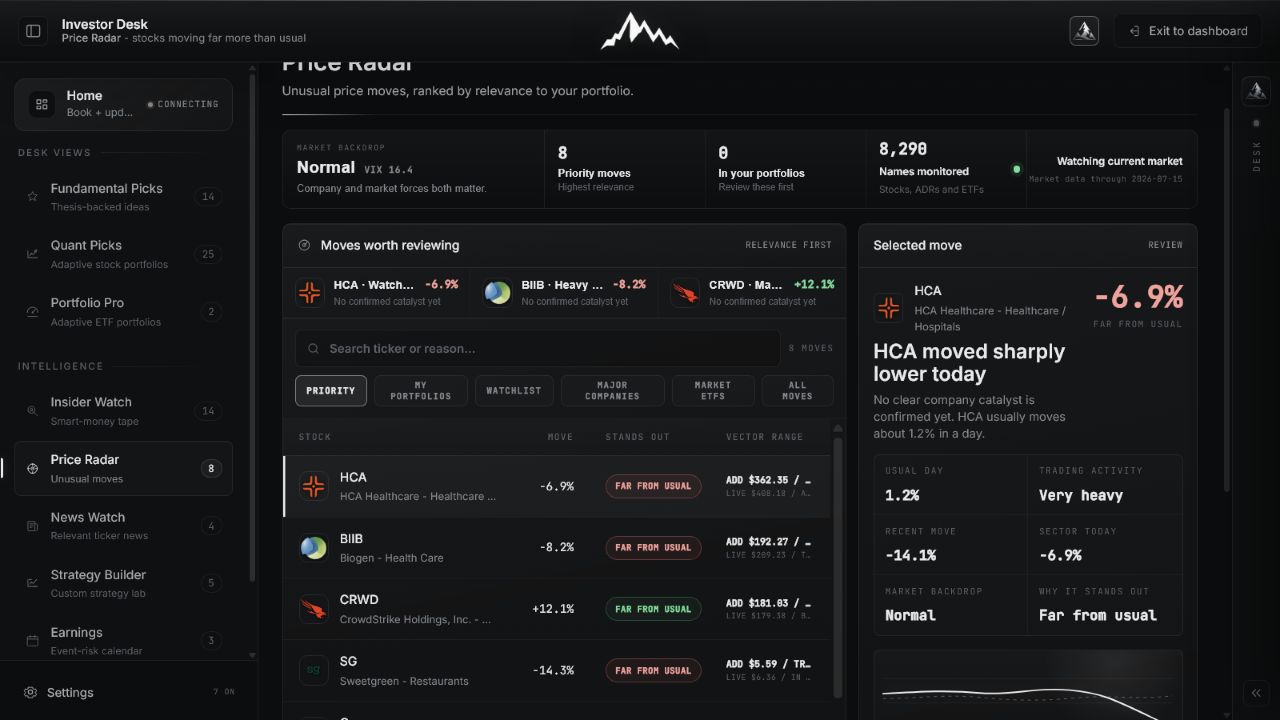
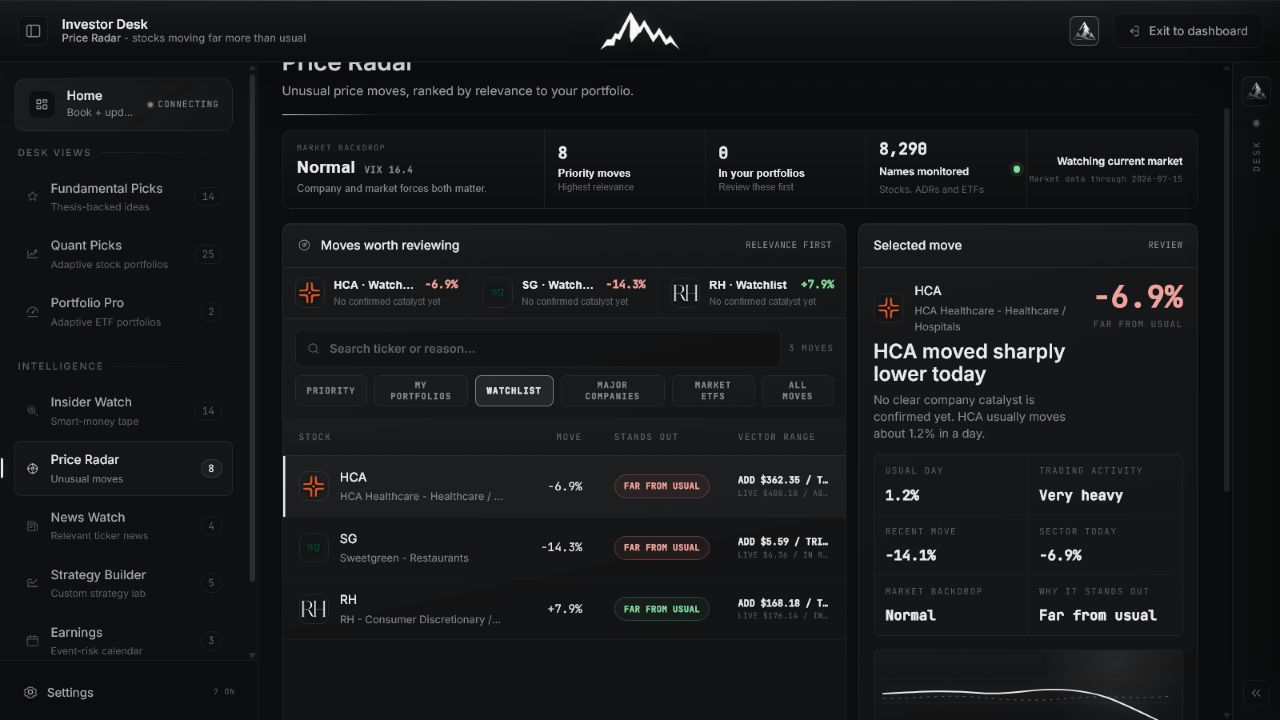
Price Radar Watchlist filter showing unusual moves in followed companies Open full image
03
Watchlist

Limit the queue to companies you explicitly follow and decide whether the move advances an existing research question.
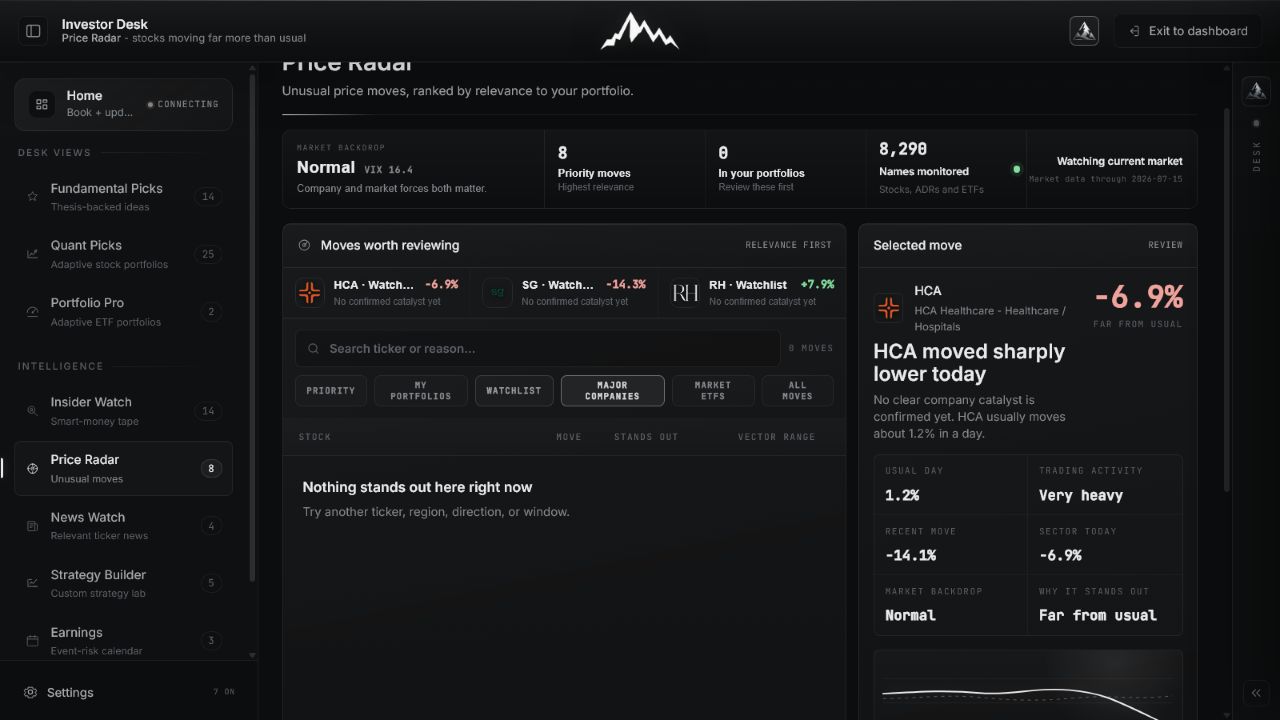
Price Radar Major companies filter showing large liquid companies Open full image
04
Major companies

Review economically important names without allowing the entire monitored universe to dominate the screen.
Price Radar Market ETFs filter showing unusual moves in broad and thematic funds Open full image
05
Market ETFs

Use broad, regional, sector, and thematic funds to test whether the shock is company-specific or visible across the market.
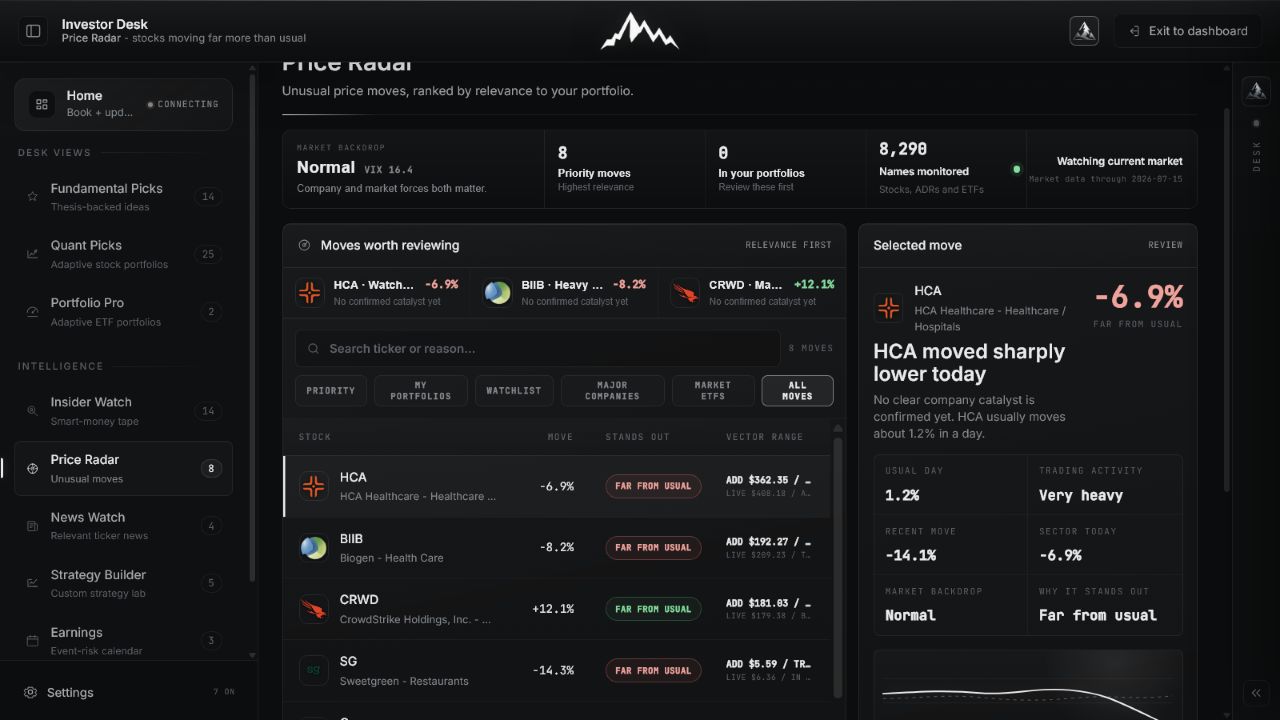
Price Radar All moves filter showing the broader monitored move universe Open full image
06
All moves

Widen discovery only when you deliberately want the broader queue; start with relevance filters for routine review.
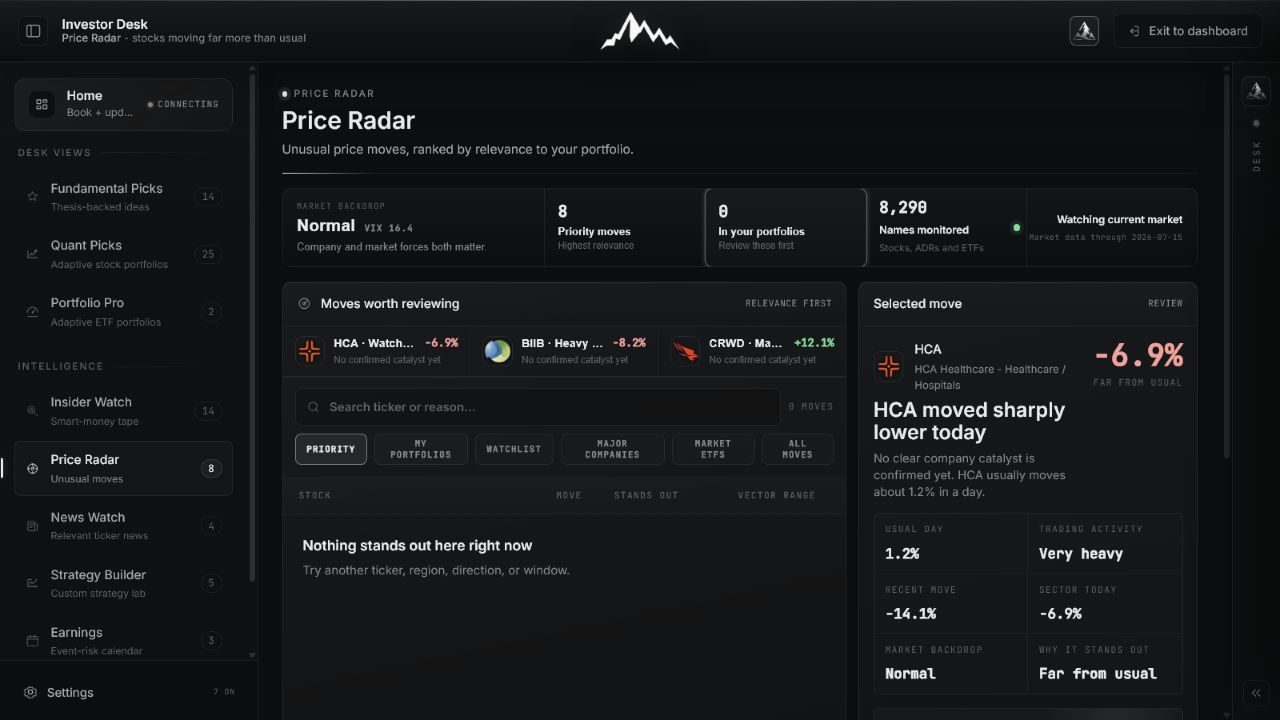
Price Radar My portfolios filter showing no material portfolio moves Open full image
07
A quiet portfolio is a valid result

Nothing stands out means no held name currently clears the materiality threshold. It is not a missing signal or failed scan.

03 / Selected move

Turn a headline percentage into a reviewable market event.

The selected panel keeps the move, usual behavior, recent path, trading activity, sector backdrop, market regime, relevance tags, and next research action together. If no catalyst is confirmed, the product says so.
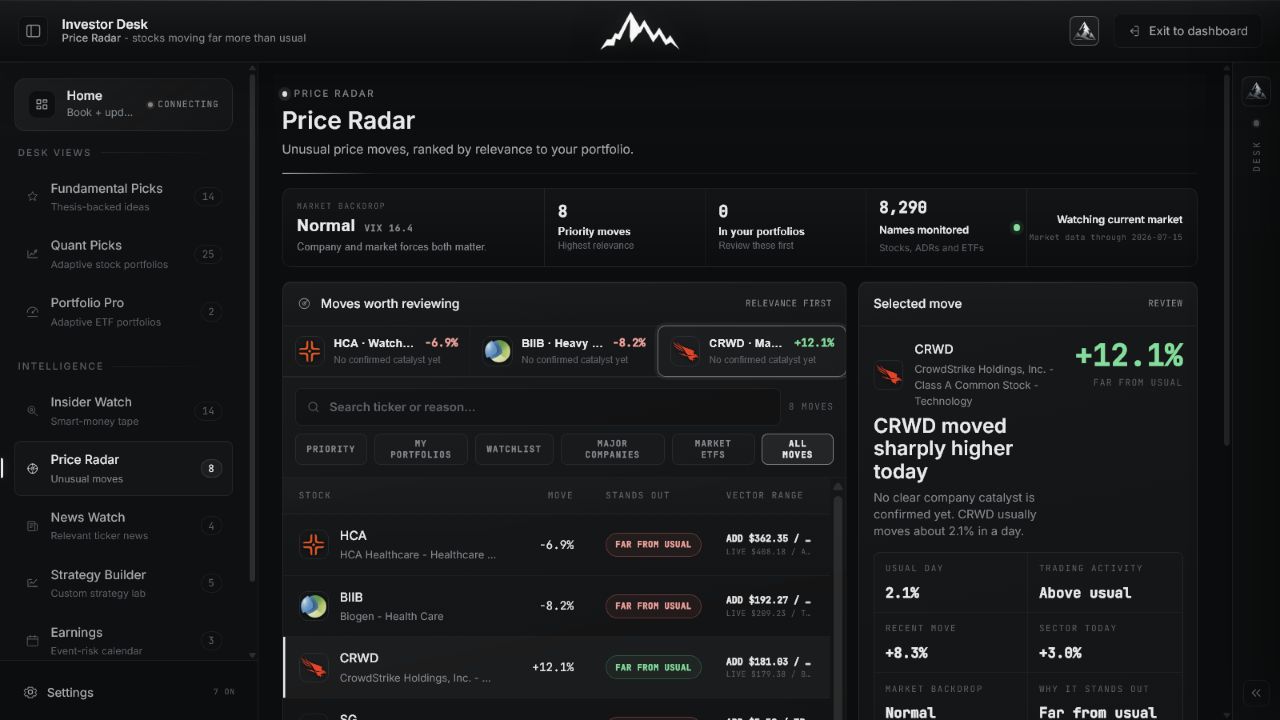
Price Radar selected positive shock with move context and next checks Open full image
08
Positive shock

A large gain receives the same discipline as a decline: compare it with normal behavior, verify volume and sector context, then inspect the range and the news.

04 / Vector Range

The range position changes the question you ask next.

Price Radar measures abnormal behavior; Vector Range locates price inside the current published market map. Reading both prevents a dramatic percentage move from being mistaken for a complete decision.
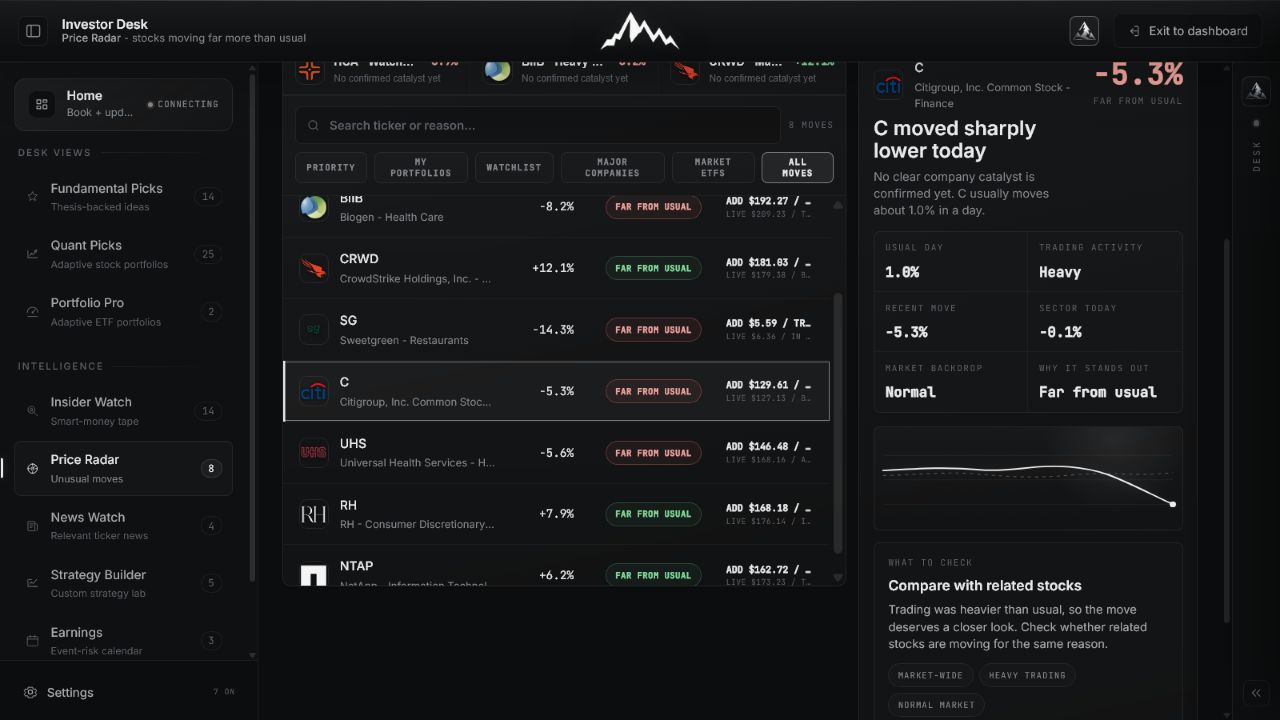
Price Radar selected move below its published Vector Range Open full image
09
Below range

Price is below the outer risk low. Verify the receipt, the catalyst, liquidity, and whether the thesis or market data has changed.
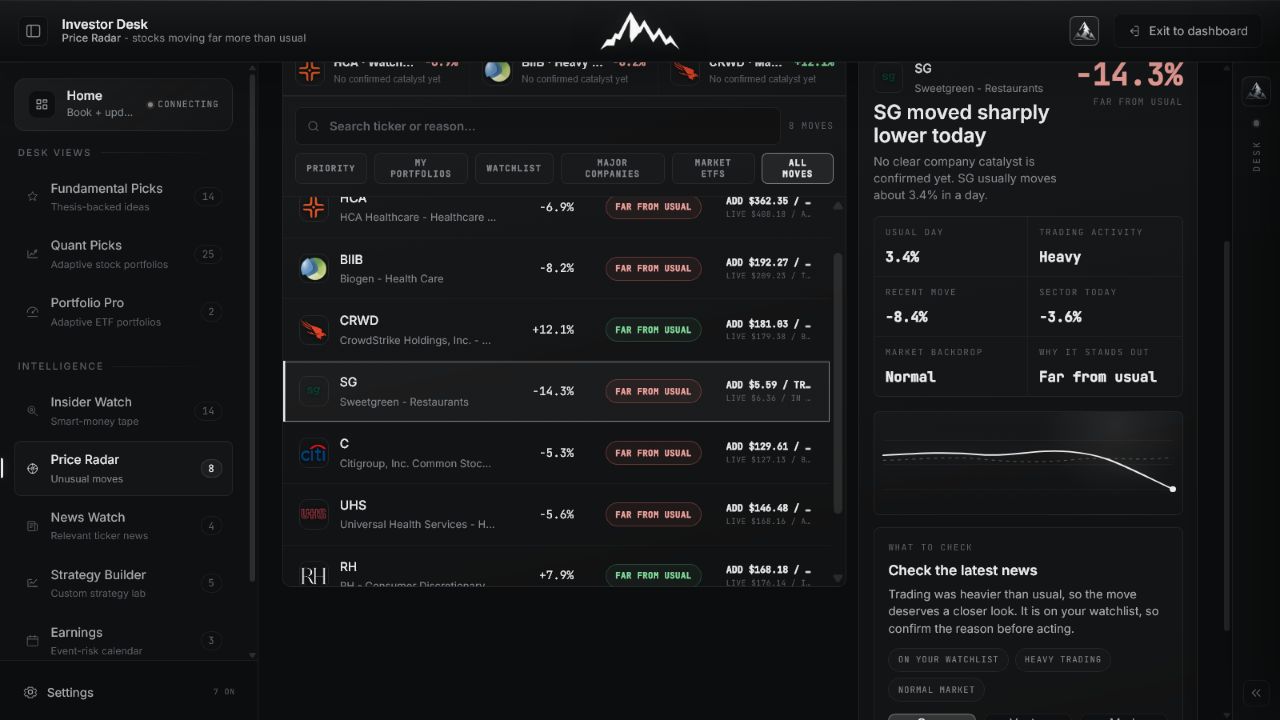
Price Radar selected move still inside its published Vector Range Open full image
10
In range

A move can be statistically unusual while price remains inside the current action band. The two statements answer different questions.
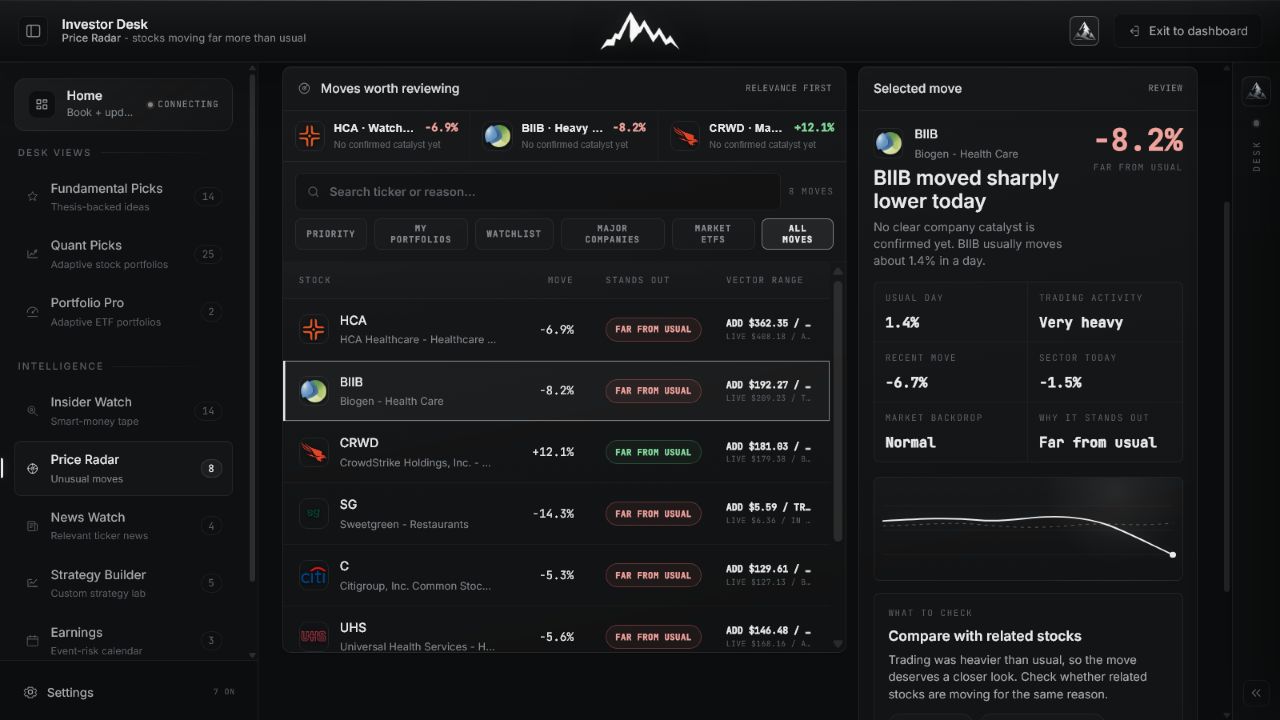
Price Radar selected move in the published Vector Range trim zone Open full image
11
Trim zone

Price is above the action high but still inside the outer range. Revisit sizing and evidence rather than reacting to the move alone.
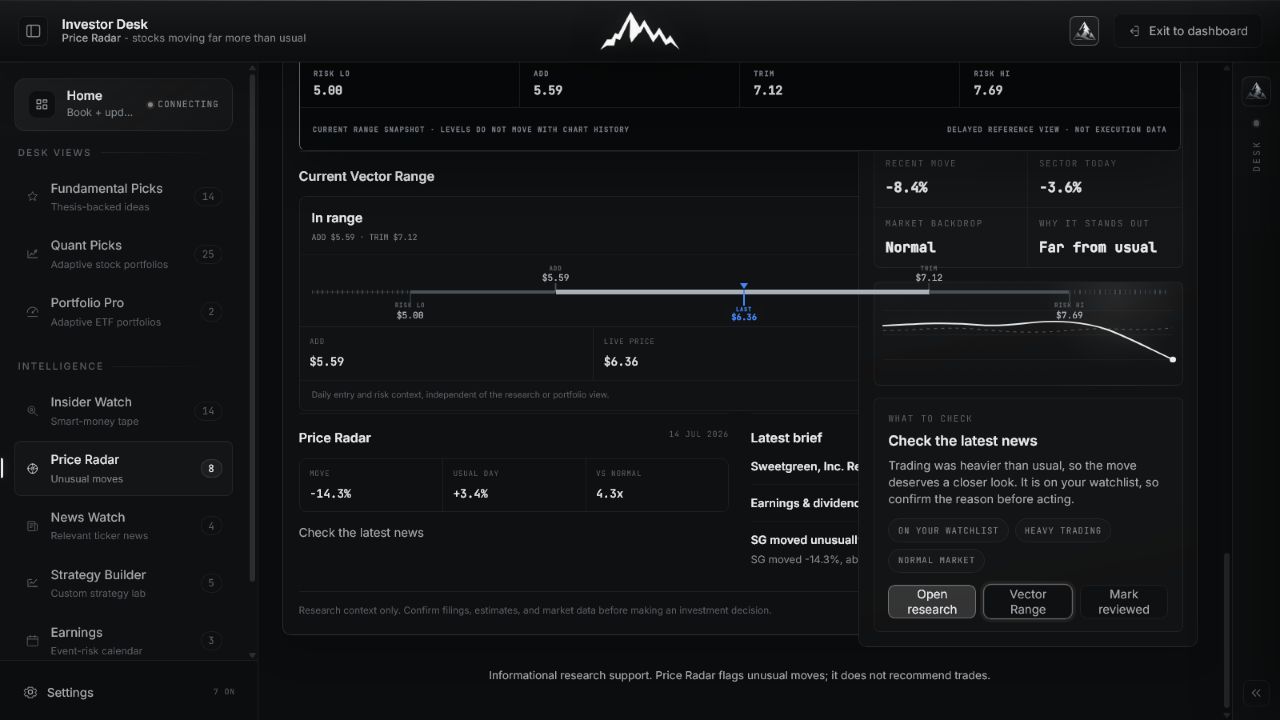
Expanded Price Radar company research with full Vector Range ladder Open full image
12
Open the full market map

Inspect risk low, buy zone, action band, trim zone, risk high, verification date, and the current company research in one expanded view.

05 / Mobile triage

The full review sequence remains usable on a phone.

Mobile keeps the live board compact, opens a selected move as a focused sheet, and stacks the full Vector Range and company research into a readable vertical path without horizontal scrolling.
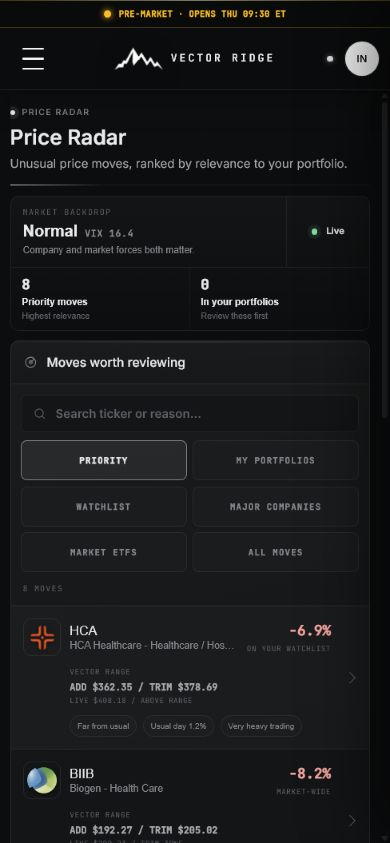
Price Radar priority board on mobile Open full image
13
Priority board

Start with the ranked moves and current market regime.
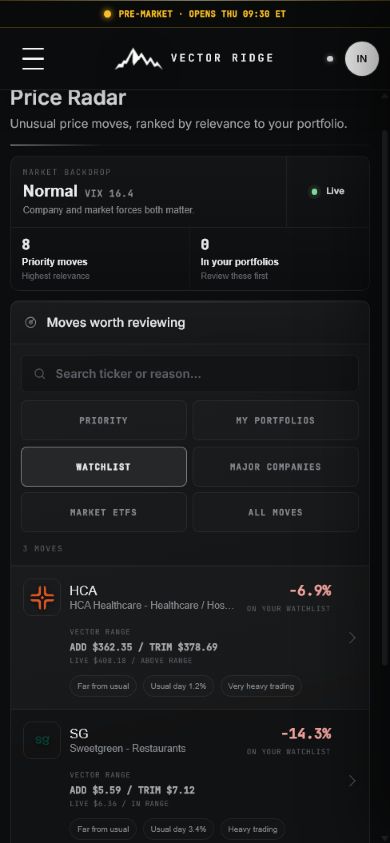
Price Radar Watchlist filter on mobile Open full image
14
Watchlist filter

Focus immediately on companies you already follow.
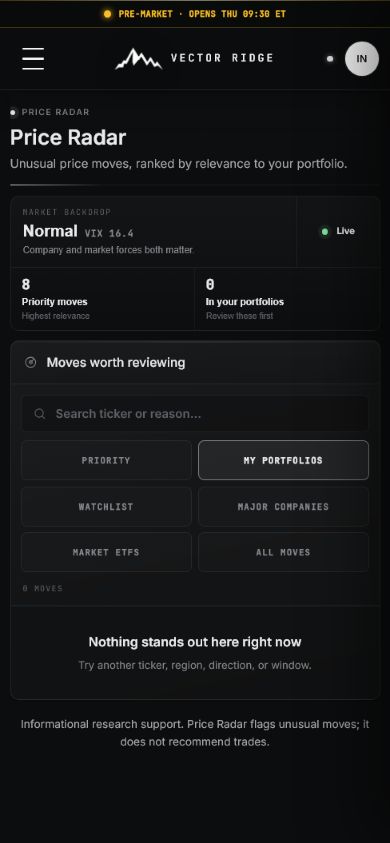
Price Radar calm portfolio state on mobile Open full image
15
Quiet portfolio

See clearly when no held company requires review.
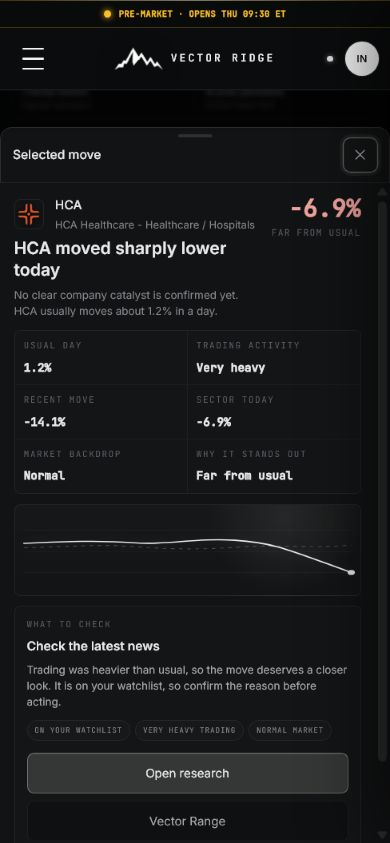
Price Radar selected negative move sheet on mobile Open full image
16
Selected move

Read abnormality, volume, market context, and the next check in one sheet.
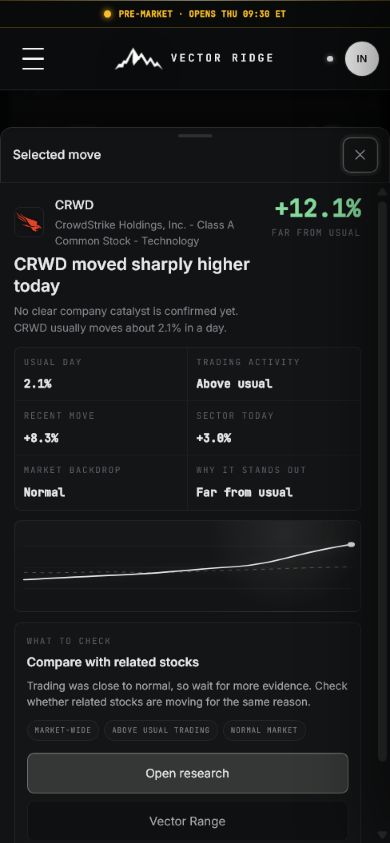
Price Radar selected positive move sheet on mobile Open full image
17
Positive shock

Review upside and downside shocks through the same evidence sequence.
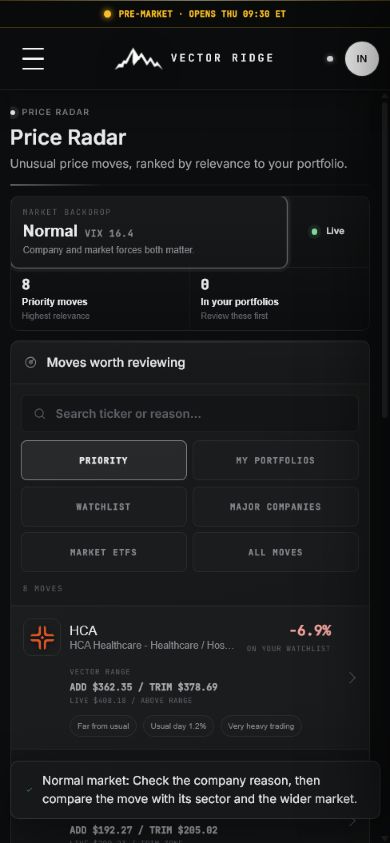
Price Radar VIX market backdrop explanation on mobile Open full image
18
Market regime

Open the backdrop to understand how broad volatility changes review priority.
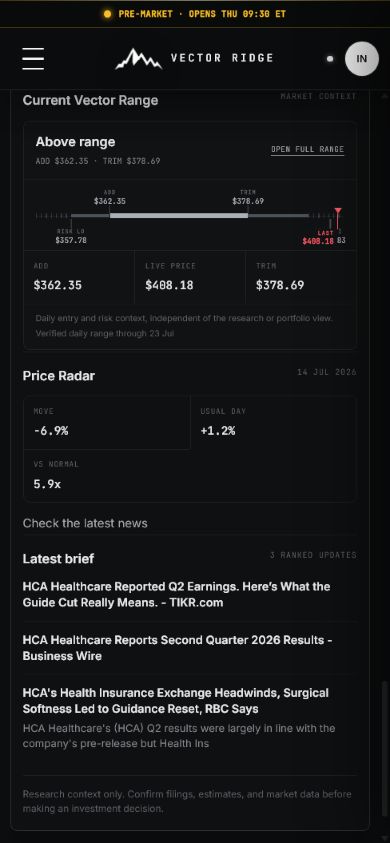
Expanded Price Radar Vector Range and company research on mobile Open full image
19
Range and research

Continue from the move into the verified market map and current company evidence.

01

How to use it

Triage the move before searching for a story.

Confirm that the move is unusual for this stock, then check exposure, trading activity, range context, and only then the latest evidence.

  1. 01

    Start with Priority

    Review the most relevant unusual moves first, with portfolio and watchlist names promoted when appropriate.

  2. 02

    Choose a universe

    Switch among portfolios, watchlist, major companies, market ETFs, or all monitored moves.

  3. 03

    Open the selected move

    Read the actual move, usual daily behavior, recent move, market backdrop, and why it stands out.

  4. 04

    Check range and research

    Use the current Vector Range and stock research to decide whether the move changes anything important.

02

Price Radar on mobile

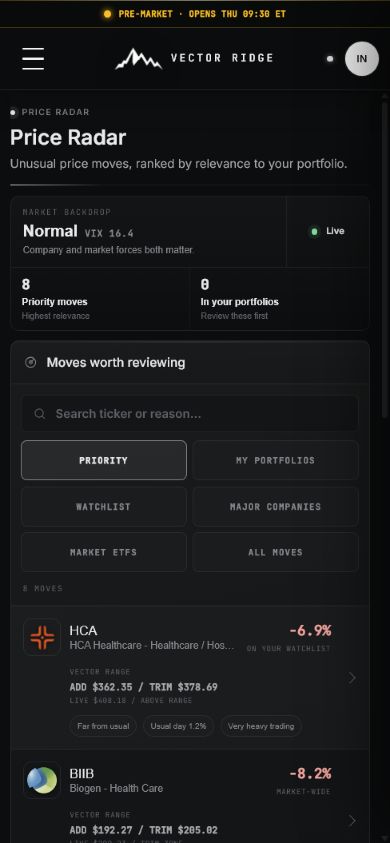
The most relevant move stays on top.

Mobile keeps portfolio and watchlist relevance, unusual-move context, and the current Vector Range attached to each reviewable name.

  • Start with PriorityReview the most relevant unusual moves first, with portfolio and watchlist names promoted when appropriate.
  • Choose a universeSwitch among portfolios, watchlist, major companies, market ETFs, or all monitored moves.
  • Open the selected moveRead the actual move, usual daily behavior, recent move, market backdrop, and why it stands out.
Price Radar shown in the mobile Investor Desk interface
Current mobile Price Radar screen.
03

Example workflow

Example: a portfolio stock drops sharply

Price Radar tells you where to look first; it does not invent a catalyst.

01

Confirm the move is abnormal for that stock

02

Check trading activity and the market backdrop

03

Open the current Vector Range

04

Review news and the thesis before changing the position

04

Updates and boundaries

Focused on the current session

Price Radar reprioritizes as prices and trading activity change. Counts and rankings are snapshots, so the selected move and displayed timestamp matter.

Move ranking Refreshes during supported market sessions
Portfolio relevance Reflects the current product rosters
Watchlist relevance Reflects the user's followed companies
Vector Range Uses the latest published range when available

Ready to use Price Radar?

Open Price Radar.

Use Price Radar with its current data, controls, and saved account context.